We're just over a month removed from Election Day 2016 and still the postmortem campaign analysis rages on. Much of the discussion has focused on Donald Trump's rise from fringe candidate to president-elect in a span of 18 months. The extent to which economic factors, the media, and/or our political parties' dysfunction fueled his ascent is an ongoing debate. Regardless, it's clear that pundits and pollsters alike drastically underestimated his appeal and chances of winning.
That's why working with Good Judgment Open (GJO) provided an awesome opportunity to gain some perspective on the campaign.
GJO is a platform birthed out of University of Pennsylvania professor Phil Tetlock's research on the merits of crowdsourced forecasting. It runs forecasting contests on a variety of global issues, asking users to assign a probability to the chance that, say, Scotland will set a date for another referendum on independence before July 1. Users can update their forecasts as new information surfaces.
During the 2016 election season, GJO partnered with The Washington Post's Monkey Cage blog to pose 45 questions related to the presidential, congressional, and gubernatorial races. A total of 8,359 unique users inputted forecasts across all the questions.
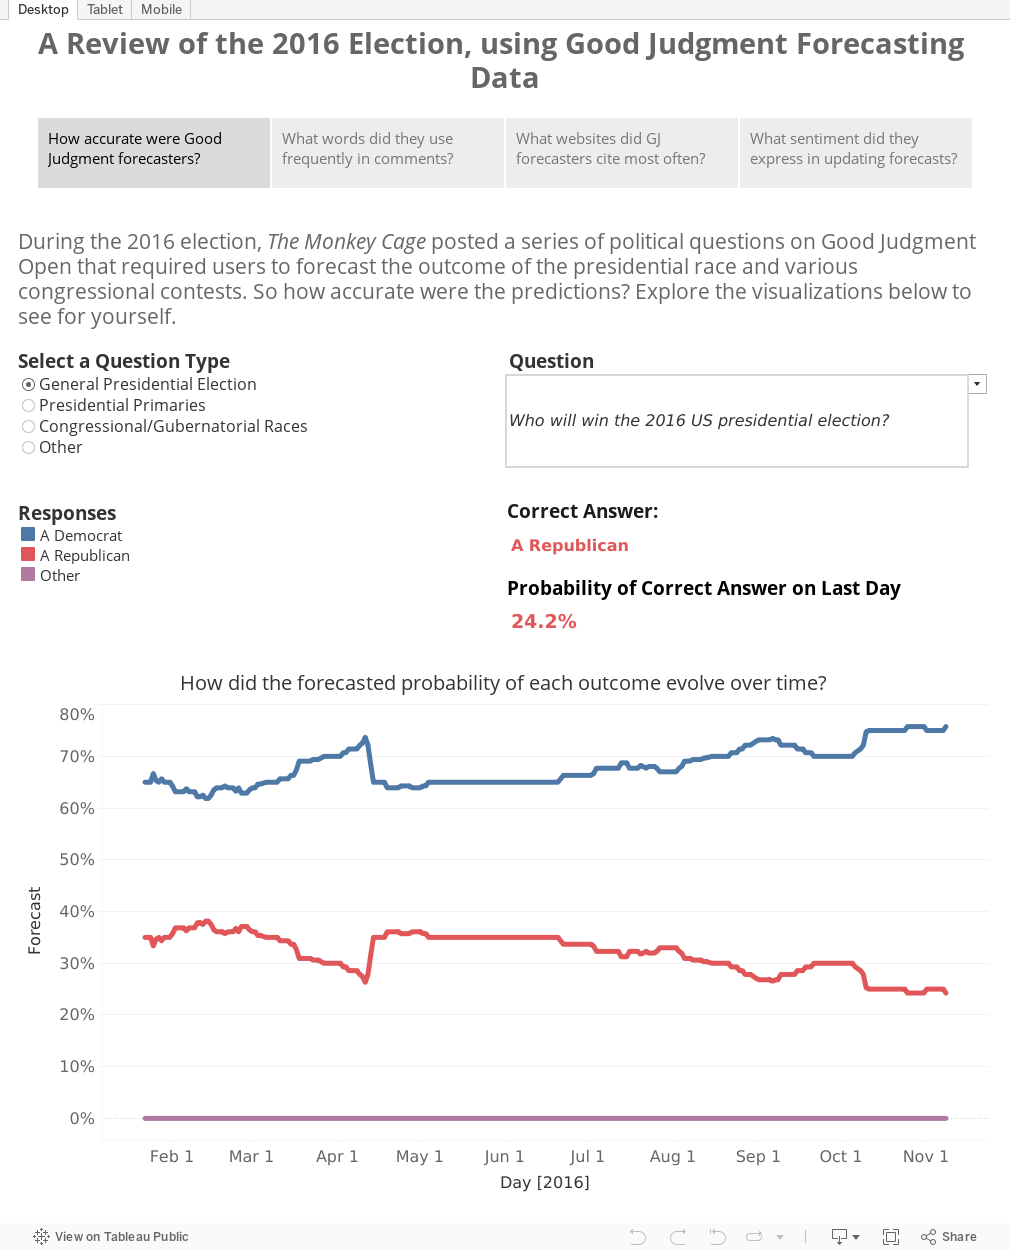
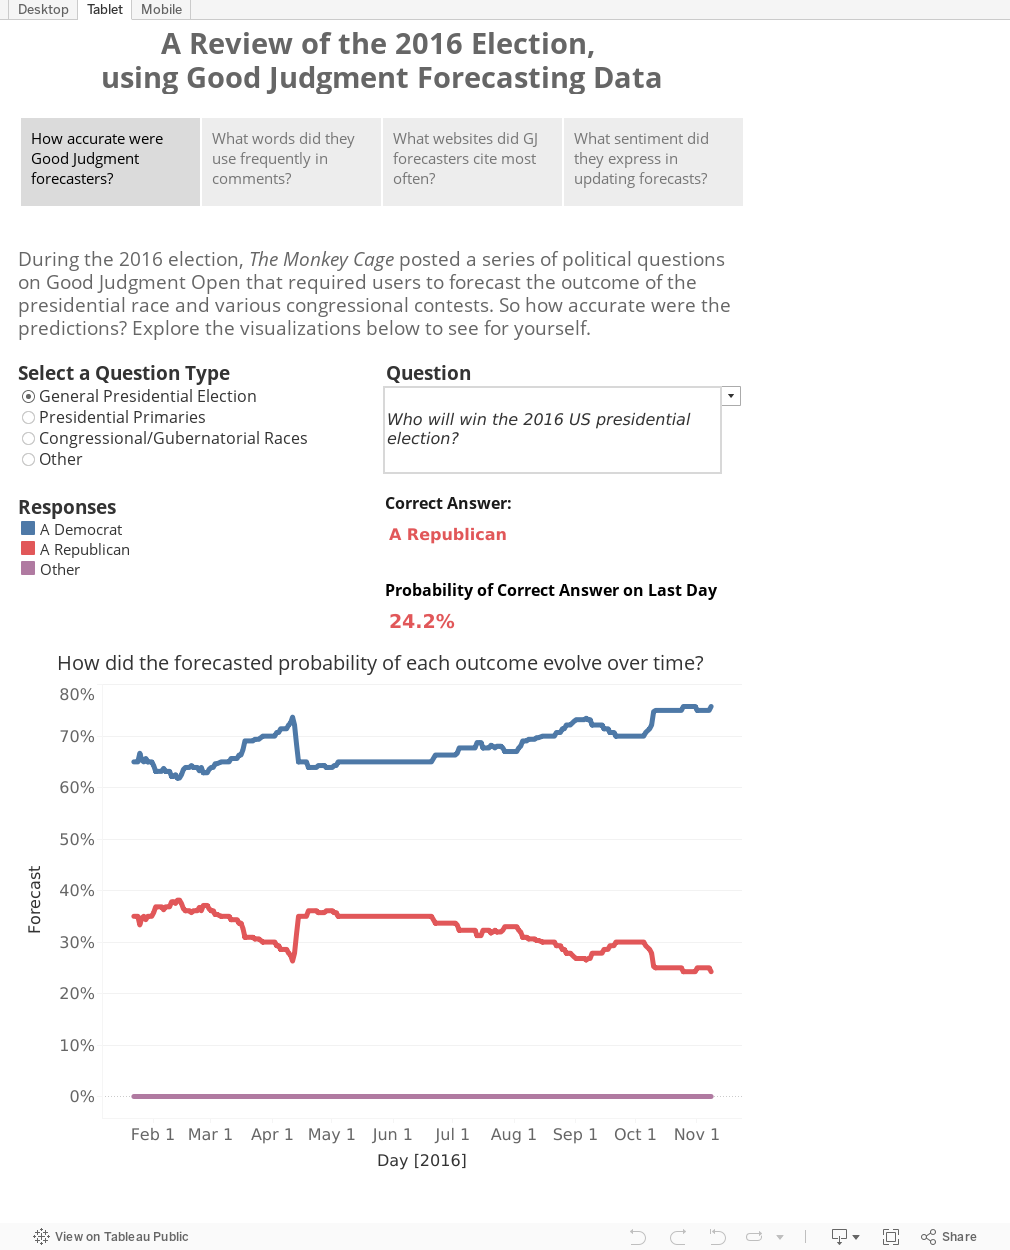
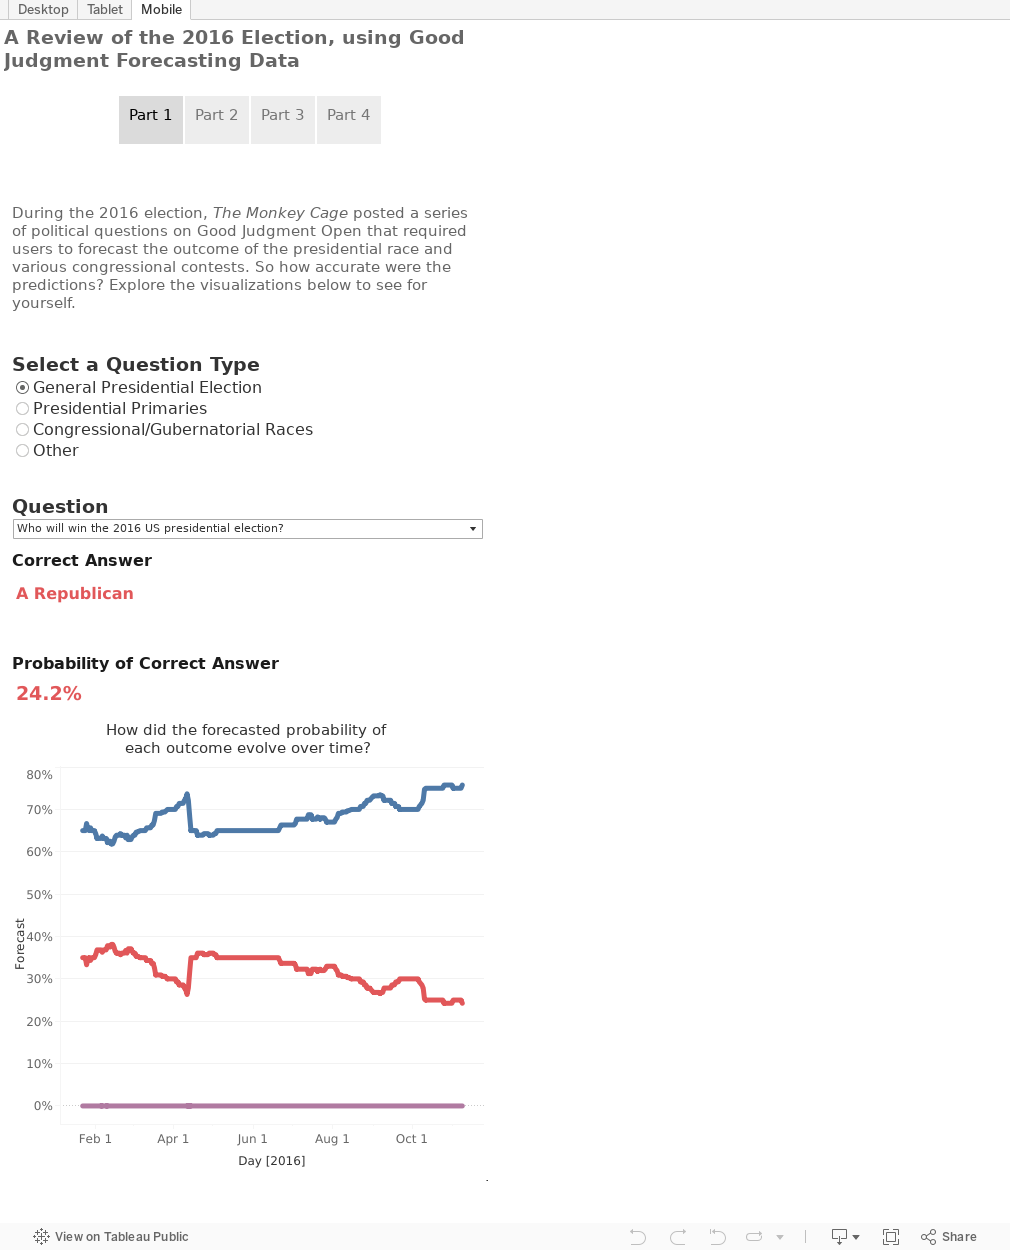
For this collab with GJO, The DataFace team built the following visual tool to sift through the data. You can look at how the average probability on certain questions evolved over time, the sources of information from which GJO users were drawing to make their predictions, and how positively or negatively they were viewing the election as it progressed.
Some key takeaways...
- On 27 of 42 questions, GJO forecasters gave the correct response over a 50% chance just before it was revealed. Some of their most blatant misses, however, came late in the campaign; they gave Trump just a 15% chance of winning Pennsylvania and a 10.2% chance of winning Michigan on November 8. They assigned only a 4.5% chance to the possibility of a split between the electoral college and popular vote.
- Like all the rest of us, GJO forecasters couldn't escape the Trump effect. His name was mentioned 2.8 times as often in comments1 as the second most frequently cited word: Clinton.
- GJO forecasters relied on a select group of outlets for their information, with almost 54% of citations in comments linking to articles from one of eight websites. FiveThirtyEight was the most frequently cited website, especially on questions pertaining to the general presidential election. This helps explain why, like FiveThirtyEight's models, GJO forecasters were more bullish on Trump's chances -- 25% on the eve of the election -- than other major outlets like The Upshot, The Huffington Post, and PredictWise.
- And finally, GJO forecasters tended to be marginally happier when they perceived that the chances of a Democratic victory were increasing. We analyzed the sentiment of comments from twelve questions with a sufficient sample2 that pitted Democrats against Republicans. For nine of them, GJO forecasters used more positive phrases in comments when adjusting their probability estimates to be more favorable to Democrats.
- A big thanks to Good Judgment Open for providing us the data and resources needed to tackle this project.
Footnotes:
- We excluded stop words like "a", "the", "and", "or", and others when computing the most frequently used words in GJO comments. ↩︎
- Most questions didn’t have a sufficient number of comments submitted by users who were updating their forecasts for this part of the analysis. Refer to the second dropdown on the "Sentiment Analysis" dashboard to see which questions were included. ↩︎


