Update: Several months ago, we wrote about the fact that gun sales in the United States had increased 83% since 1999. That figure was based on data from the FBI’s National Instant Criminal Background Check (NICS). Since the time of writing, the NICS has released several additional months of data, providing a more complete picture of US gun statistics for 2017. In light of the tragic events in Florida several weeks ago, we’ve elected to update this piece to reflect more recent numbers. US gun sales have still increased substantially in the last two decades, but data from the last year provides more nuance.
Tracking the number of guns sold in the United States is no easy task. Federal law requires firearm dealers to keep records of gun transactions, but -- here’s the catch -- it also prohibits that data from being stored in a central repository. Some states have more stringent laws to encourage record keeping, but their requirements often only apply to certain types of guns or dealers.
So instead of using gun sale data, most researchers use total background checks as a proxy. Since 1998, Federal Firearms Licensees have been required to query the FBI’s National Instant Criminal Background Check System (NICS) at the checkout counter to verify a buyer is eligible to purchase a gun. The FBI tracks and releases data on the number of background checks submitted by month, state, and gun type.
Gun Sale Statistics Leading up to 2017
We take a cue from The New York Times’s analysis in 2015, which used NICS data to estimate US gun sales. Like NYT, we rely on a conversion outlined in the Small Arms Survey: long gun and handgun checks count as 1.1 sales, while a multiple gun check counts as two. We toss out Hawaii, for which we have limited data.
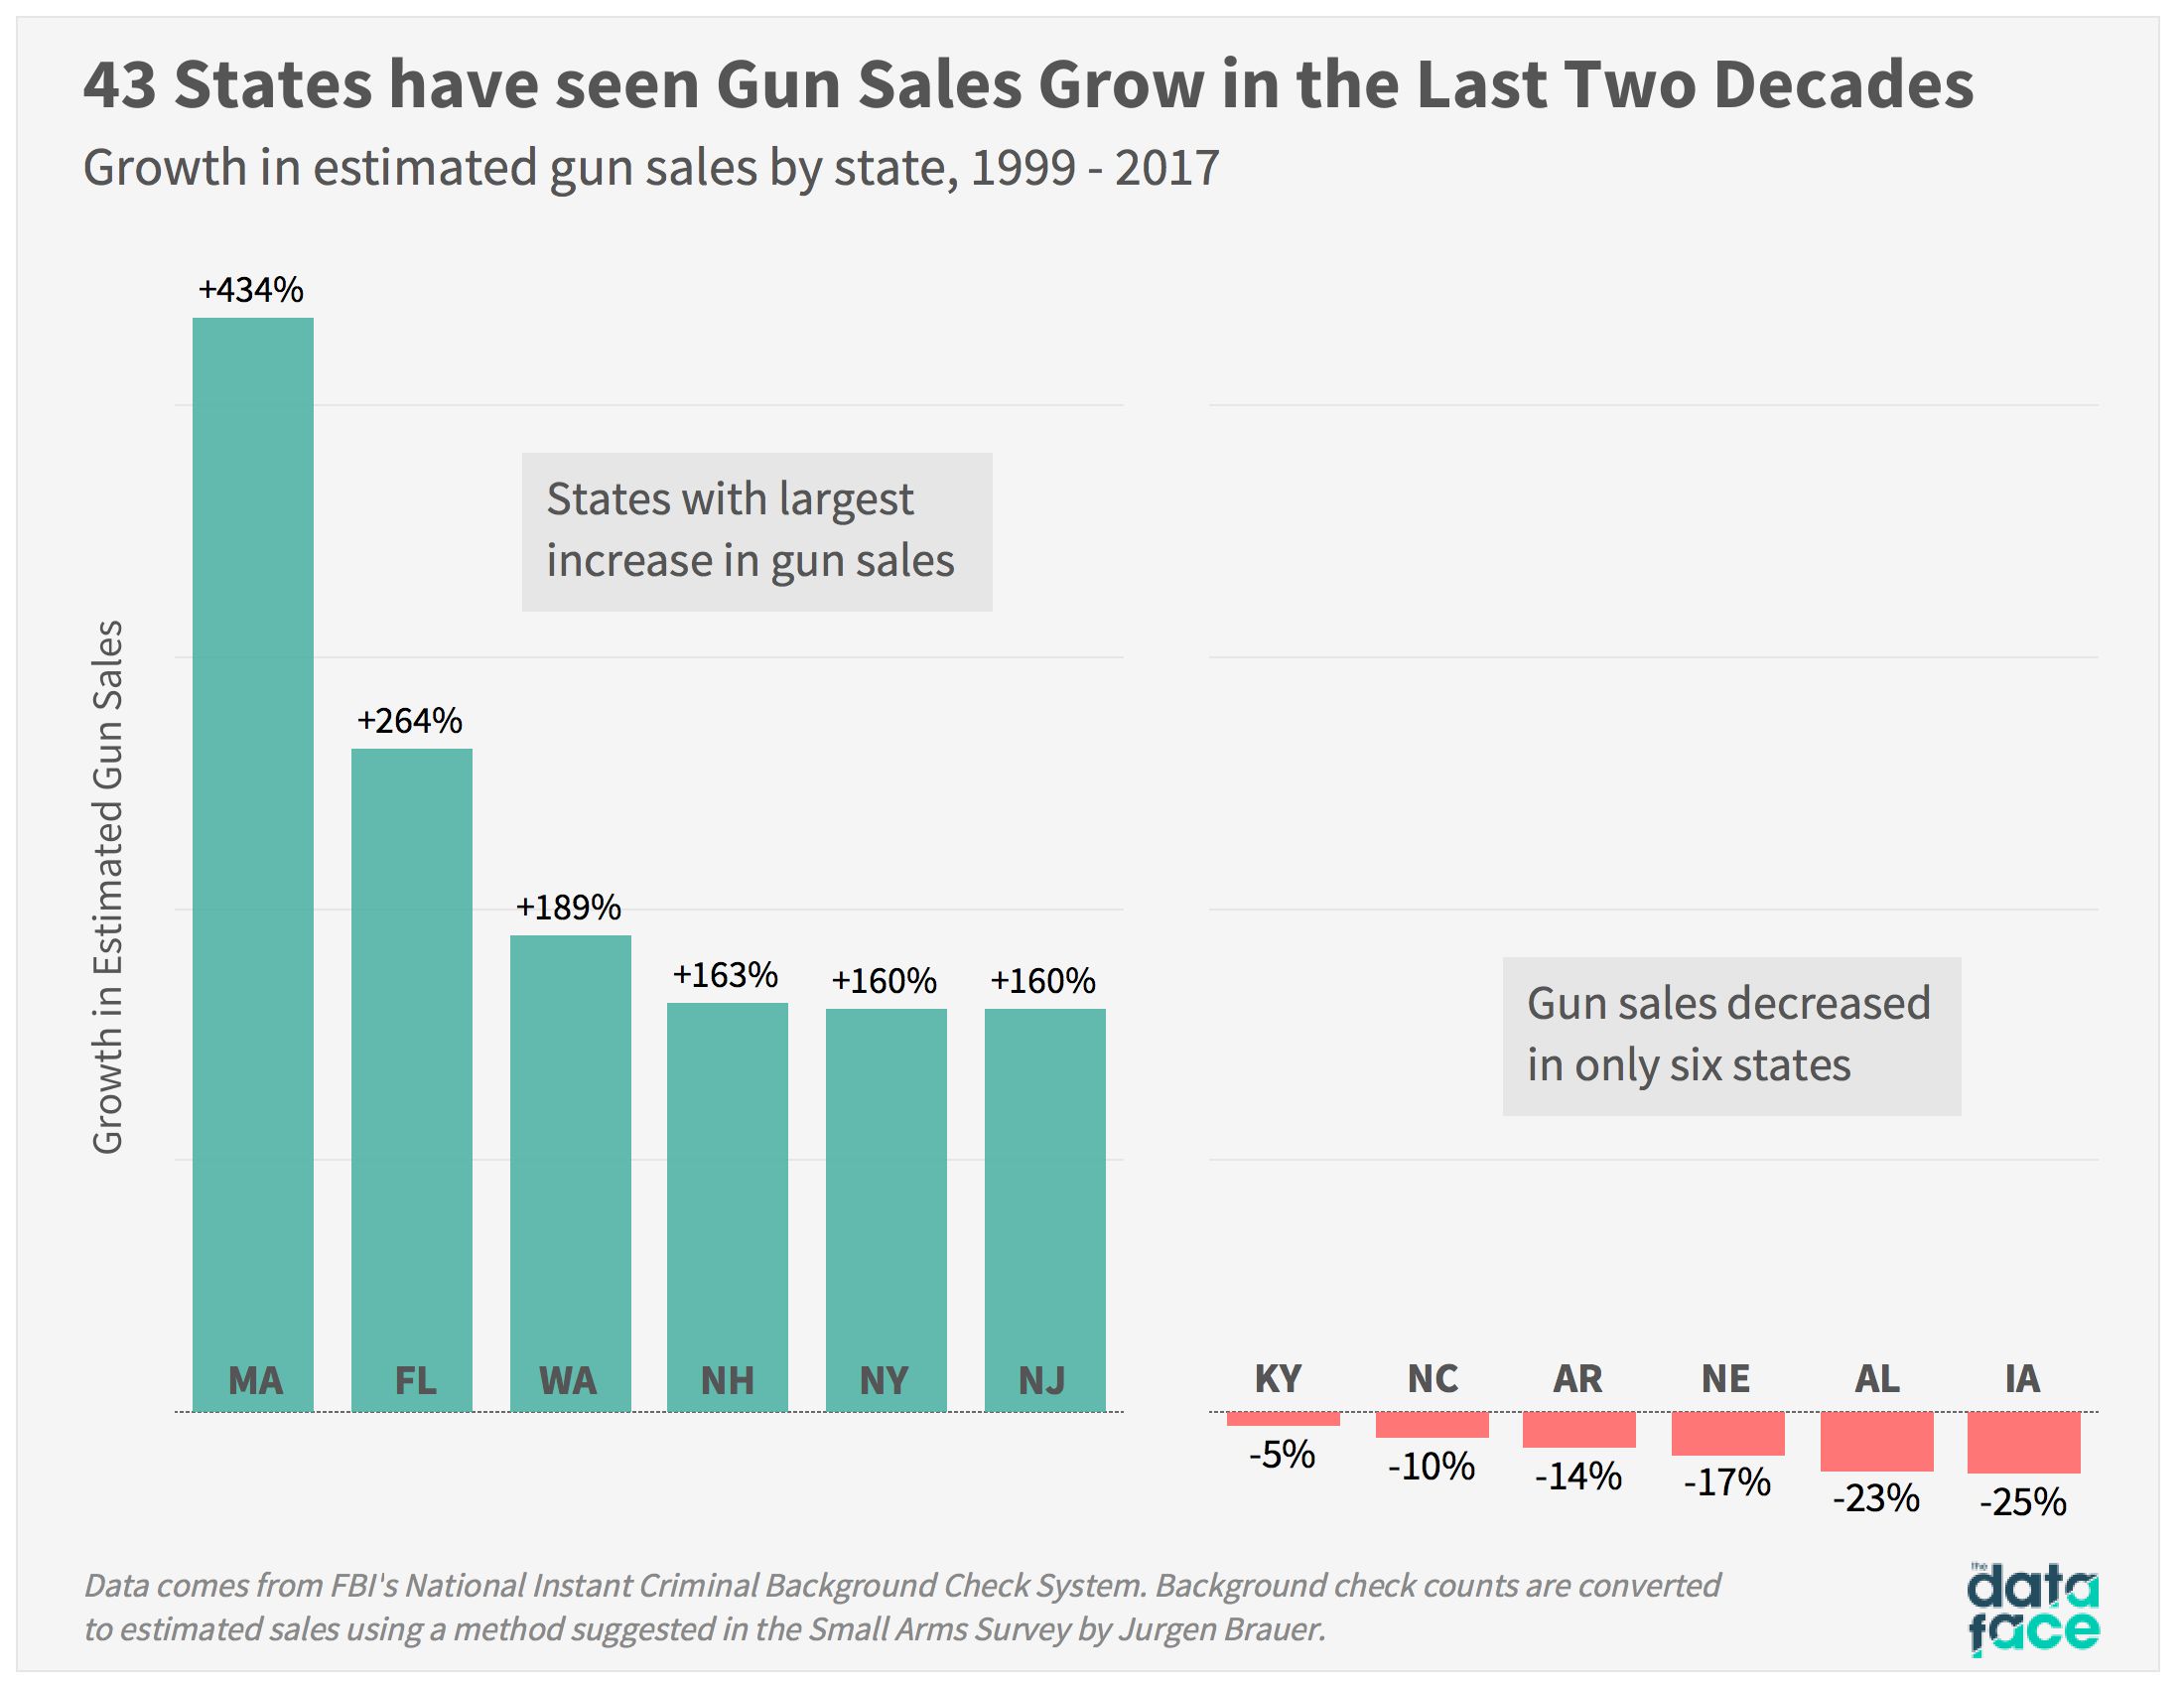
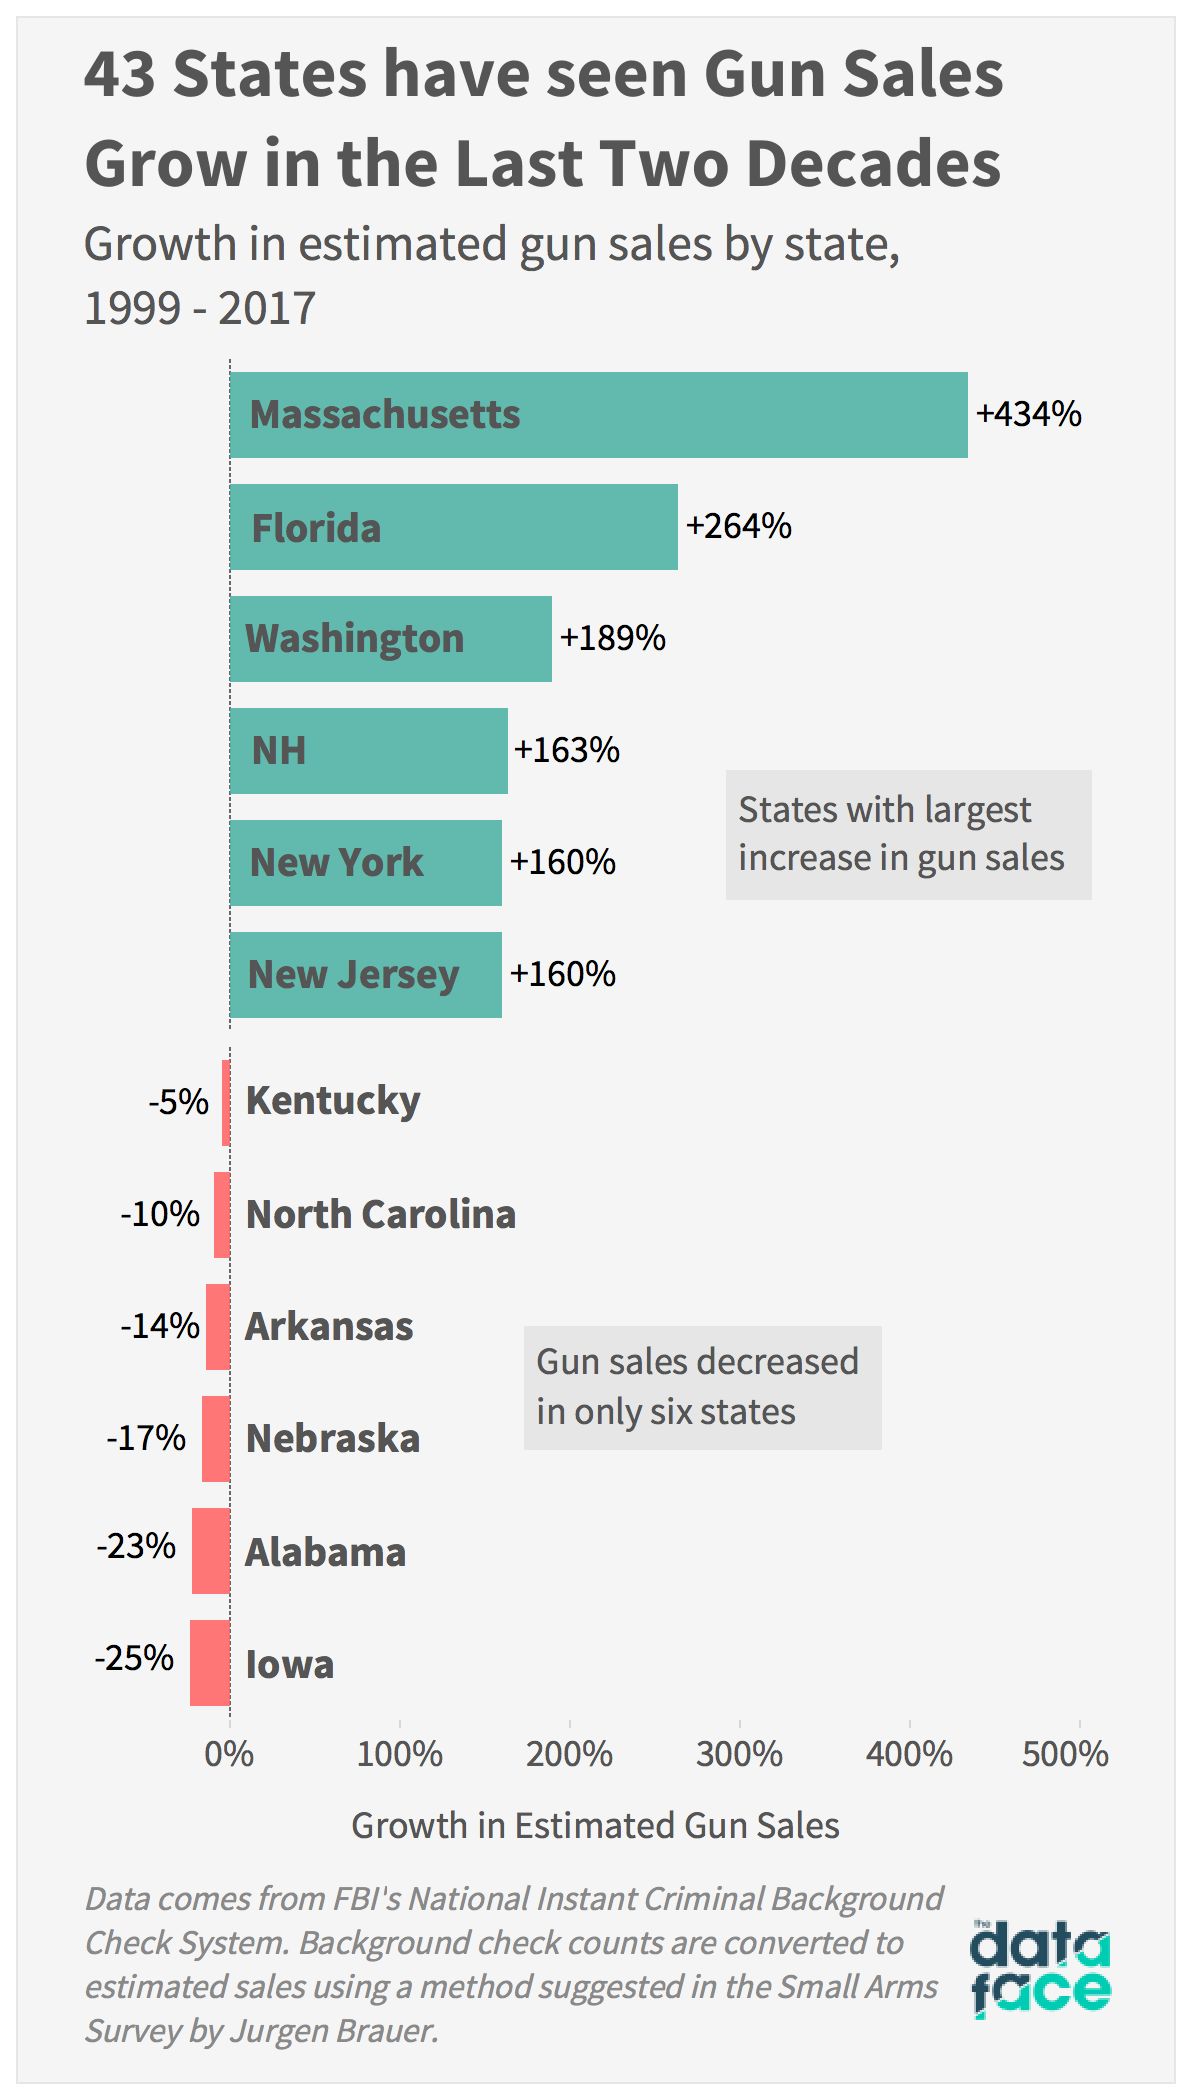
Here’s a look at how estimated US gun sales by state have changed since 1999, the first year for which we have complete data. Forty-three states have seen gun sales grow since the FBI implemented its NICS system and 15 states have seen them more than double. Gun sales have declined in only six states (excluding Hawaii).
Bear in mind that background checks from the FBI are an imperfect approximation of gun sales. These numbers don’t include private sales, which constitute about 40 percent of gun transactions. Still, it is widely considered the best available benchmark.
Per Capita, Gun Sales Have Increased Since 1999
On a per capita basis, most states have seen gun sales grow over the last 18 years. Even as new residents have flooded states like Florida, guns have outpaced population growth. In 1999, there were under two guns sold publicly for every 100 Floridian residents. In 2017, that number was up to five guns sold for every hundred residents.
Want more stuff like this? Sign up for our newsletter.
Still, Florida’s gun sales per capita don’t compare to states like Alaska, South Dakota, and Montana, where guns sold publicly hover around one for every ten residents.

Gun Sales Decreased by State in 2017
In a previous version of this project, that’s where the story stopped. Over the long term, gun sales in the United States have been increasing dramatically across most states. With 2017 data now in hand, that remains the case.
From a myopic view, however, gun sale statistics for 2017 present an interesting anomaly. Estimated gun sales actually declined by over 11% nationwide in 2017. It’s the third largest year-over-year decline in sales since the NICS was implemented.
And this trend isn’t confined to a few key states. Instead, a dip in gun sales by state was observed across the U.S. in 2017. Every state saw sales decline, including more pro-gun states like Montana, Wyoming, and West Virginia.
Connecticut and Alabama were the two states that saw the largest drop off in gun sales on a percentage basis.


This trend is particularly surprising in light of recent events. 2017 was the deadliest year in American history for mass shootings, with the tragedies that struck Las Vegas, the church in Sutherland Spring, TX, and 344 other places. Typically, a byproduct of these shootings is increased demand for guns; a fear of increased gun regulation brings gun buyers to the store and pushes gun manufacturers’ stock prices up. Gun sales spiked massively in 2012 following the Sandy Hook shooting, for instance.
In 2017, however, this phenomenon has been competing with another force: the “Trump slump”. With the prospect of relaxed gun laws for the next four years, demand has diminished and guns sales in the US have waned. In 2017, the “Trump slump” seems to have overpowered a few momentary blips.
Since the shooting at Majory Stoneman Douglas High School, Trump has sent mixed signals on whether he’d be willing to support tighter gun regulation. If he does take on the NRA, that could drive demand back up, at least temporarily. For now we wait, knowing that 2017 could prove a turning of the tides.
Nerd Notes:
Graphic created in Tableau.
Data comes from the FBI's NICS report, courtesy of Buzzfeed's data editor, Jeremy Singer-Vine. Jeremy wrote a neat little parser to extract data from the FBI's PDF report and put it into a spreadsheet. You can access the GitHub repo here. The data is updated on a monthly basis.


