Client Work Case Study
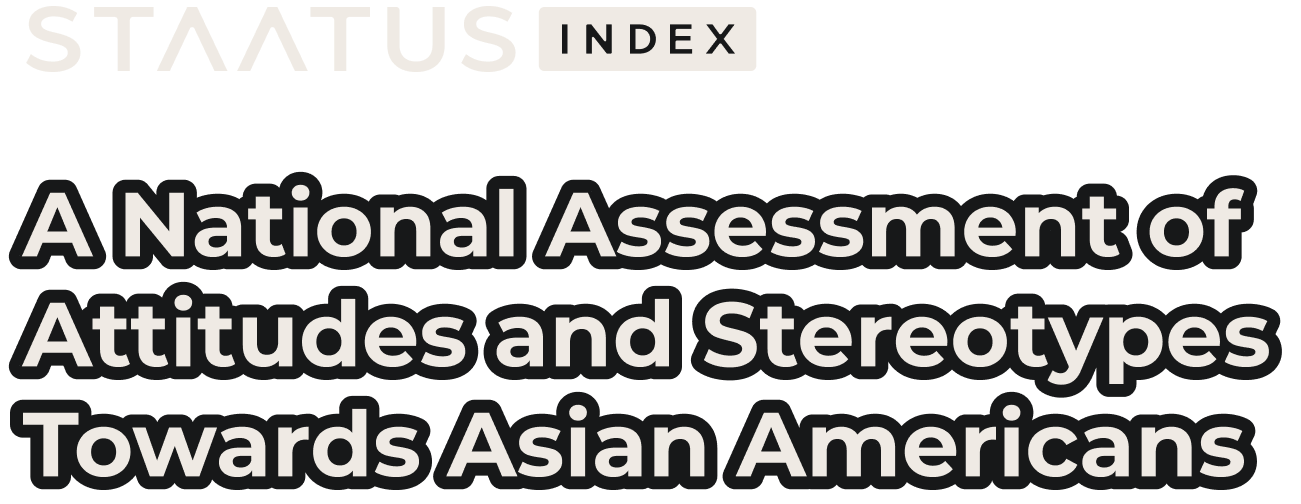
STAATUS Index 2021
Background
In response to heightened violence against Asian Americans in the U.S., the newly formed organization Leading Asian Americans to Unite for Change (LAAUNCH) conducted a national study in early 2021 to unearth data on the attitudes and perceptions of Asian Americans. Named the STAATUS Index (Social Tracking of Asian Americans in the United States), this was one of the first such studies in more than 20 years.
LAAUNCH intended to arm policymakers, educators, business leaders, the media, and other Asian American organizations with this information to help drive actionable insights and solutions to curb the current acts of racism, as well as erase racist stereotypes and myths about Asian Americans.
Project Details
Client

Date
April 2021–May 2021
Audience
The population of the United States broadly as well as global allies to the cause.
solution
We developed a static, downloadable PDF report that documents LAAUNCH's groundbreaking data findings using impactful imagery, graphical stats, and eye-opening data visualizations. Along with the PDF report, we compiled key findings and created interactive data visualizations for a microsite within the client's website using Webflow. This way, users could investigate the data themselves, share findings effectively on social media, and help galvanize change.
Result
The project was shared widely; the published report was cited by many major media outlets and garnered over 1.6 billion media impressions in total. The client was very pleased with the overwhelmingly positive reception.
Project Goals
Bring awareness to the violence facing Asian Americans in the wake of the COVID-19 pandemic.
Facilitate understanding of the perceptions and stereotypes facing Asian Americans currently.
Share the powerful data findings our client uncovered in their nationwide survey in an easy-to-understand and impactful manner.
Research Methods
Data Sources
The STAATUS Index survey data was provided by our client, LAAUNCH, directly. The survey was taken by 2,766 participants US residents, ages 18 and over, conducted online between March 29 to April 14, 2021, by Savanta Research. It included multiple question types and pulled demographic data on respondents for comprehensive analysis.
Analysis
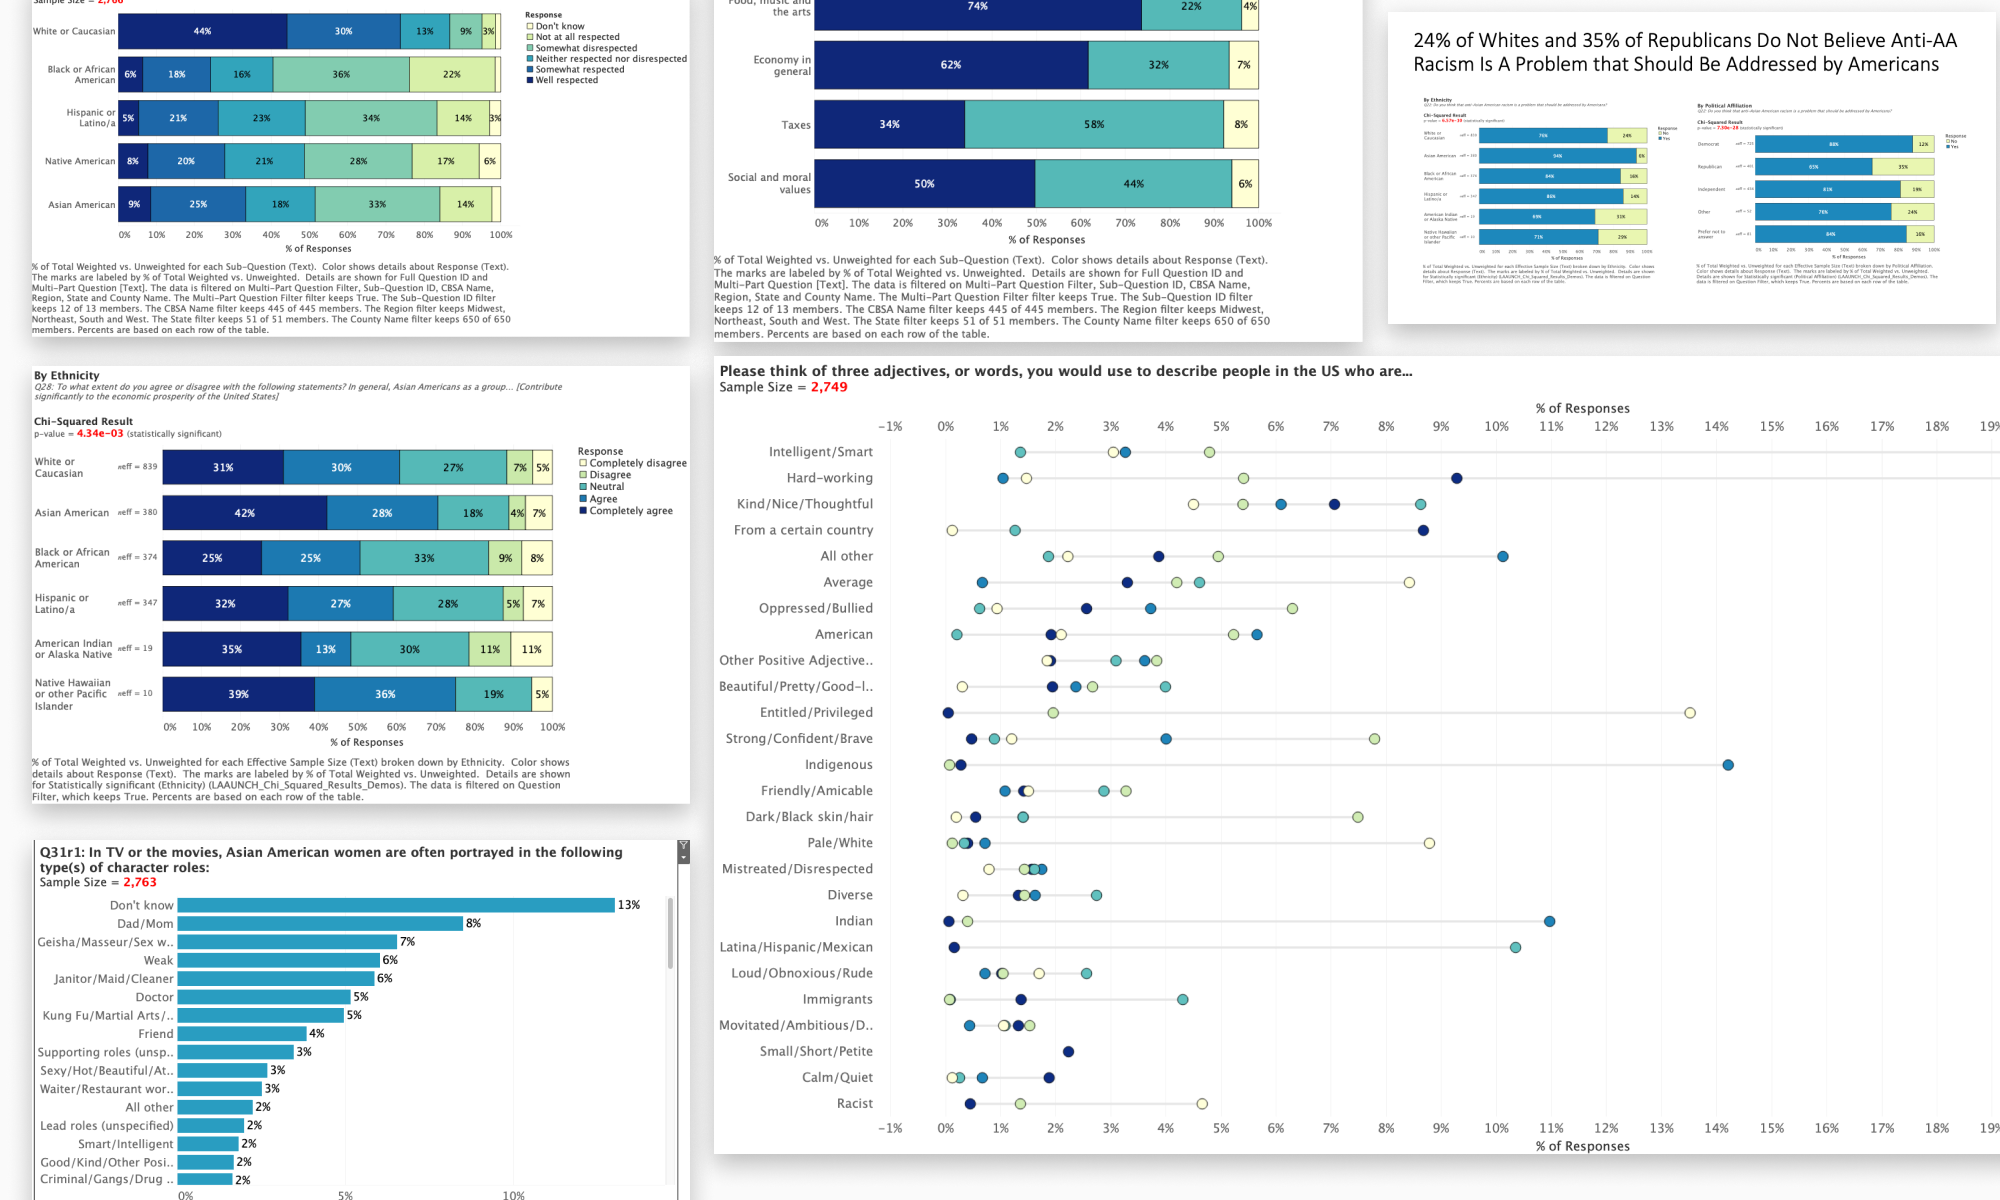
The client came to us with some preliminary ideas based on an internal review of the data. We then took the survey data and performed our analysis in Tableau, exploring and cross-tabulating the results for each question. We used Tableau to pull out key insights collaboratively, and our client crafted copy around those insights.
We focused much of our analysis on how various groups of people responded differently to certain questions. We found that by breaking out the results by ethnicity (white Americans, Hispanic/Latino Americans, Black Americans, and Asian Americans) and political affiliation (Democrat vs. Republican), we were able to expose clear divides within the population on certain issues.
We had to navigate a few challenges with the data, such as how to make the survey reflect the attitudes and perceptions of the nation as a whole. To solve for this, we devised a weighting system that placed more emphasis on some responses than others, to mirror the overall U.S. population. We also limited our analysis to specific questions where the sample size was deemed sufficient.
More information can be found in the Methodology section of the STAATUS Index 2021 PDF report.
Design
By the end of April 2021, we were ready to move into the design phase of the project. First, we tackled the PDF report, then the microsite design and build.
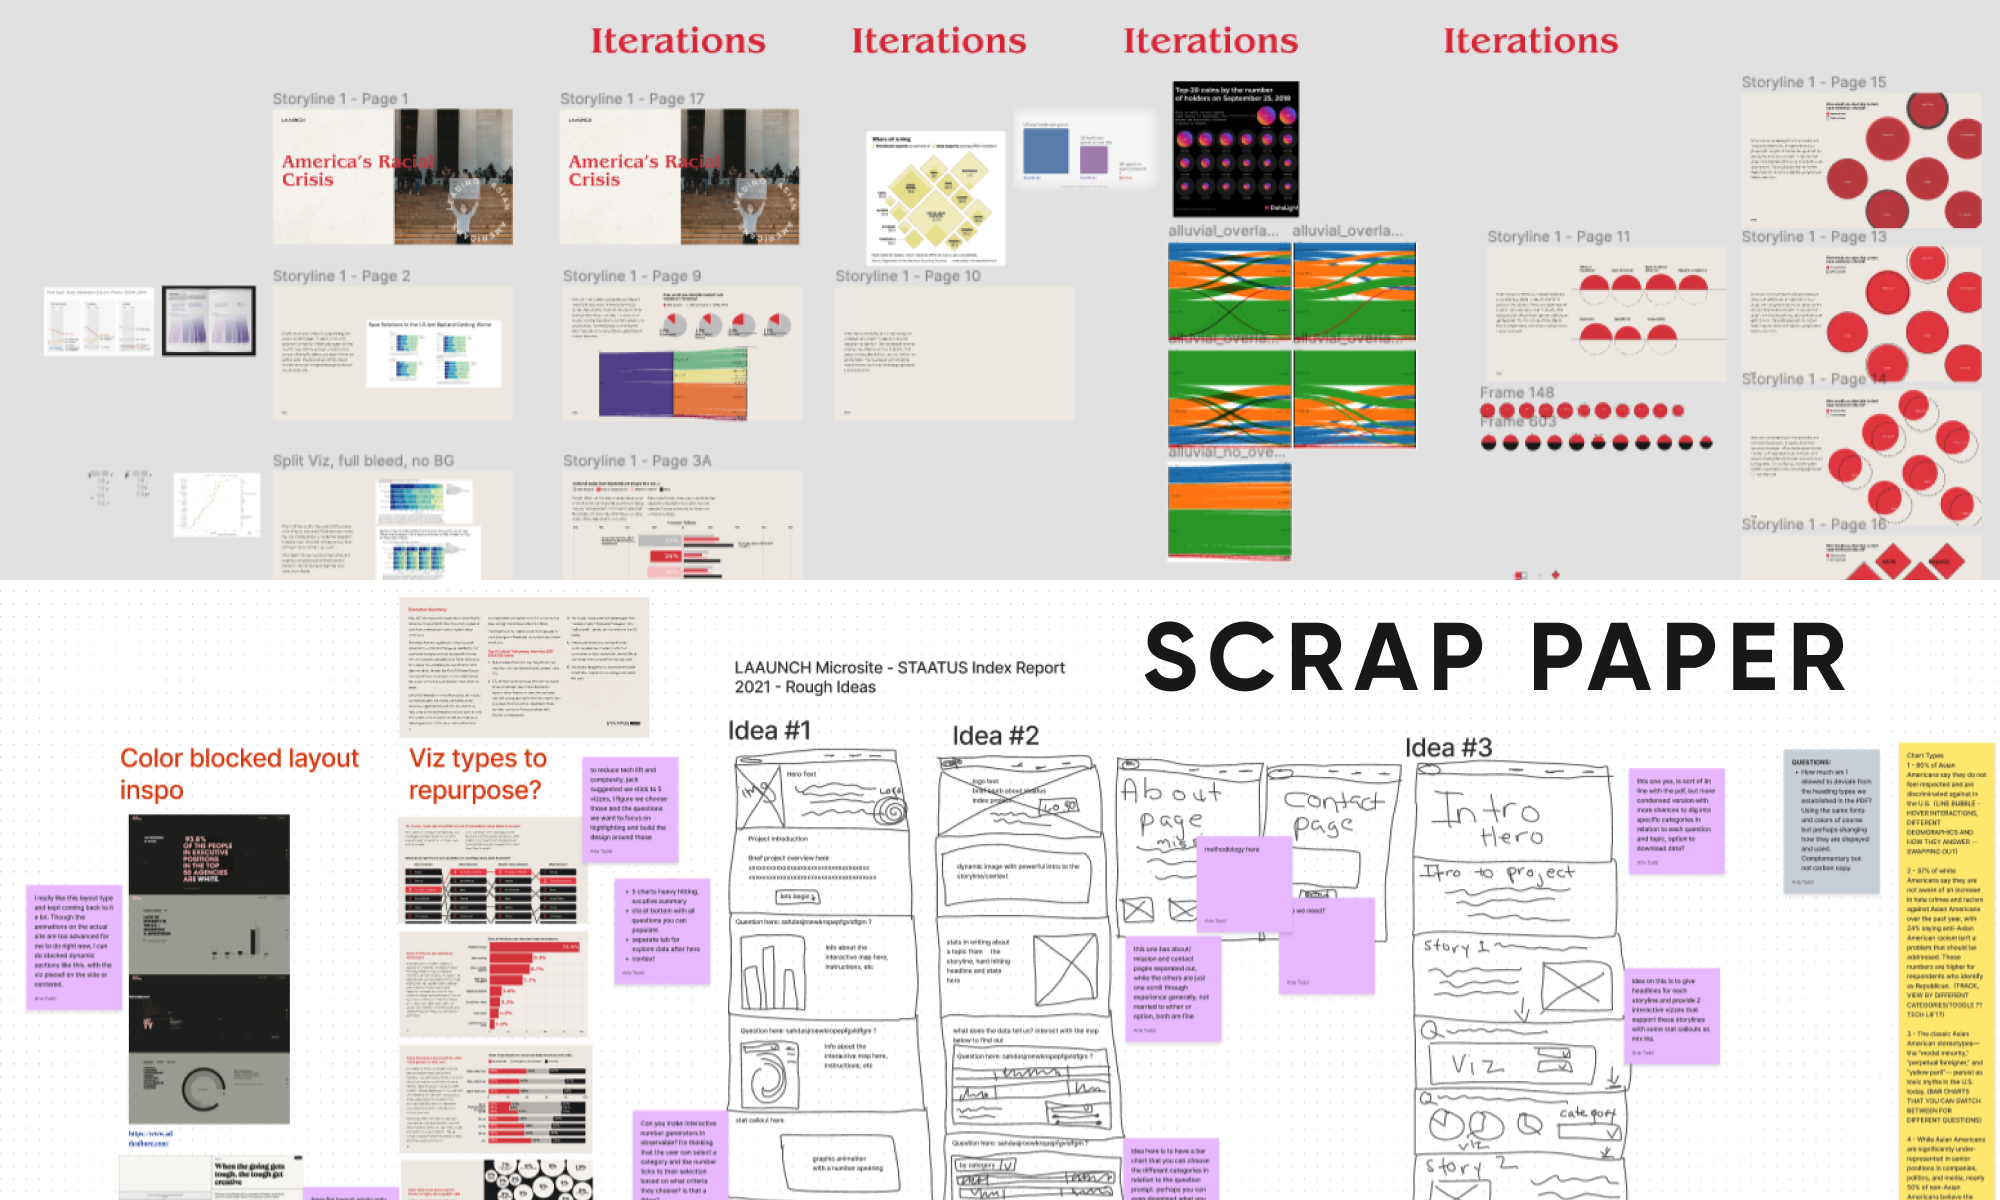
Concepting
To start, we brainstormed different visualization types that would best convey the survey data. We kept the following questions in mind to guide our iterations.
With these in mind, we began crafting the story and checked in with the client periodically to make sure our creative vision aligned with their expectations. We treated the PDF report as the grounding document for everything that followed; the accompanying microsite became an interactive, streamlined version of highlights from the PDF.
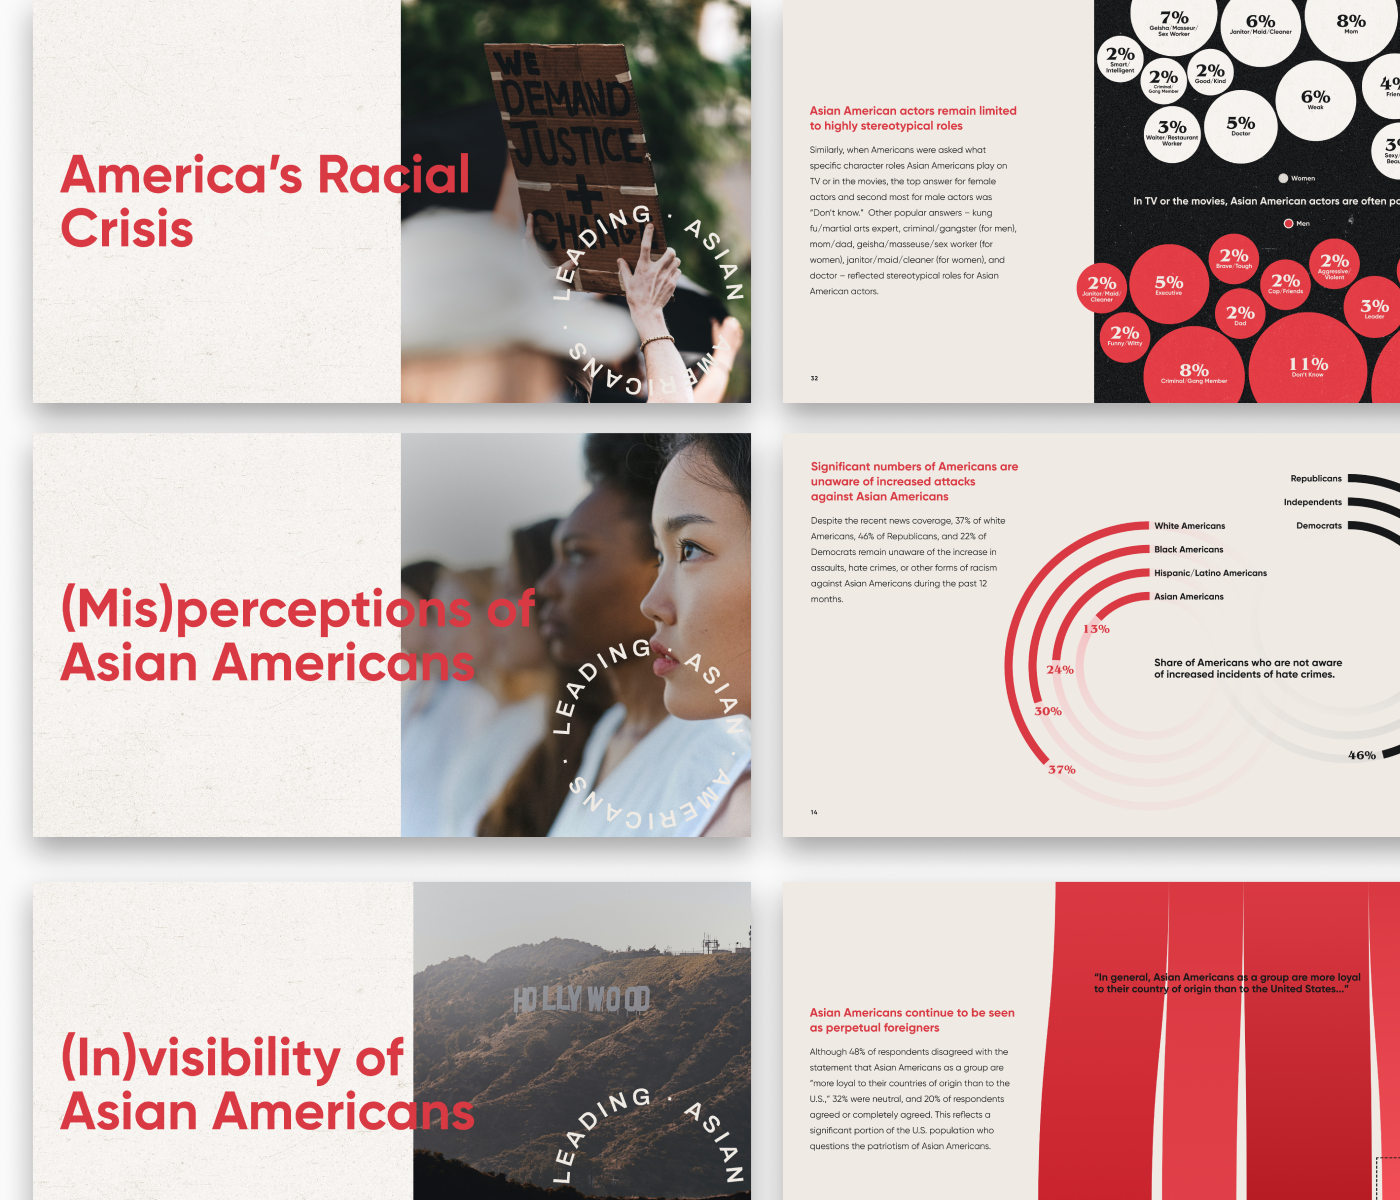
In a static document, content layout and document hierarchy are really important. We wanted the pages in LAAUNCH's report to "flow" into one another neatly, backed up by the data we were presenting.
What key findings are most important to highlight?
How can we make the information clear and concise for all audiences?
How might we present findings in a way to galvanize action among the masses?
How should we best use team strengths to craft these separate but related experiences most effectively and promptly?
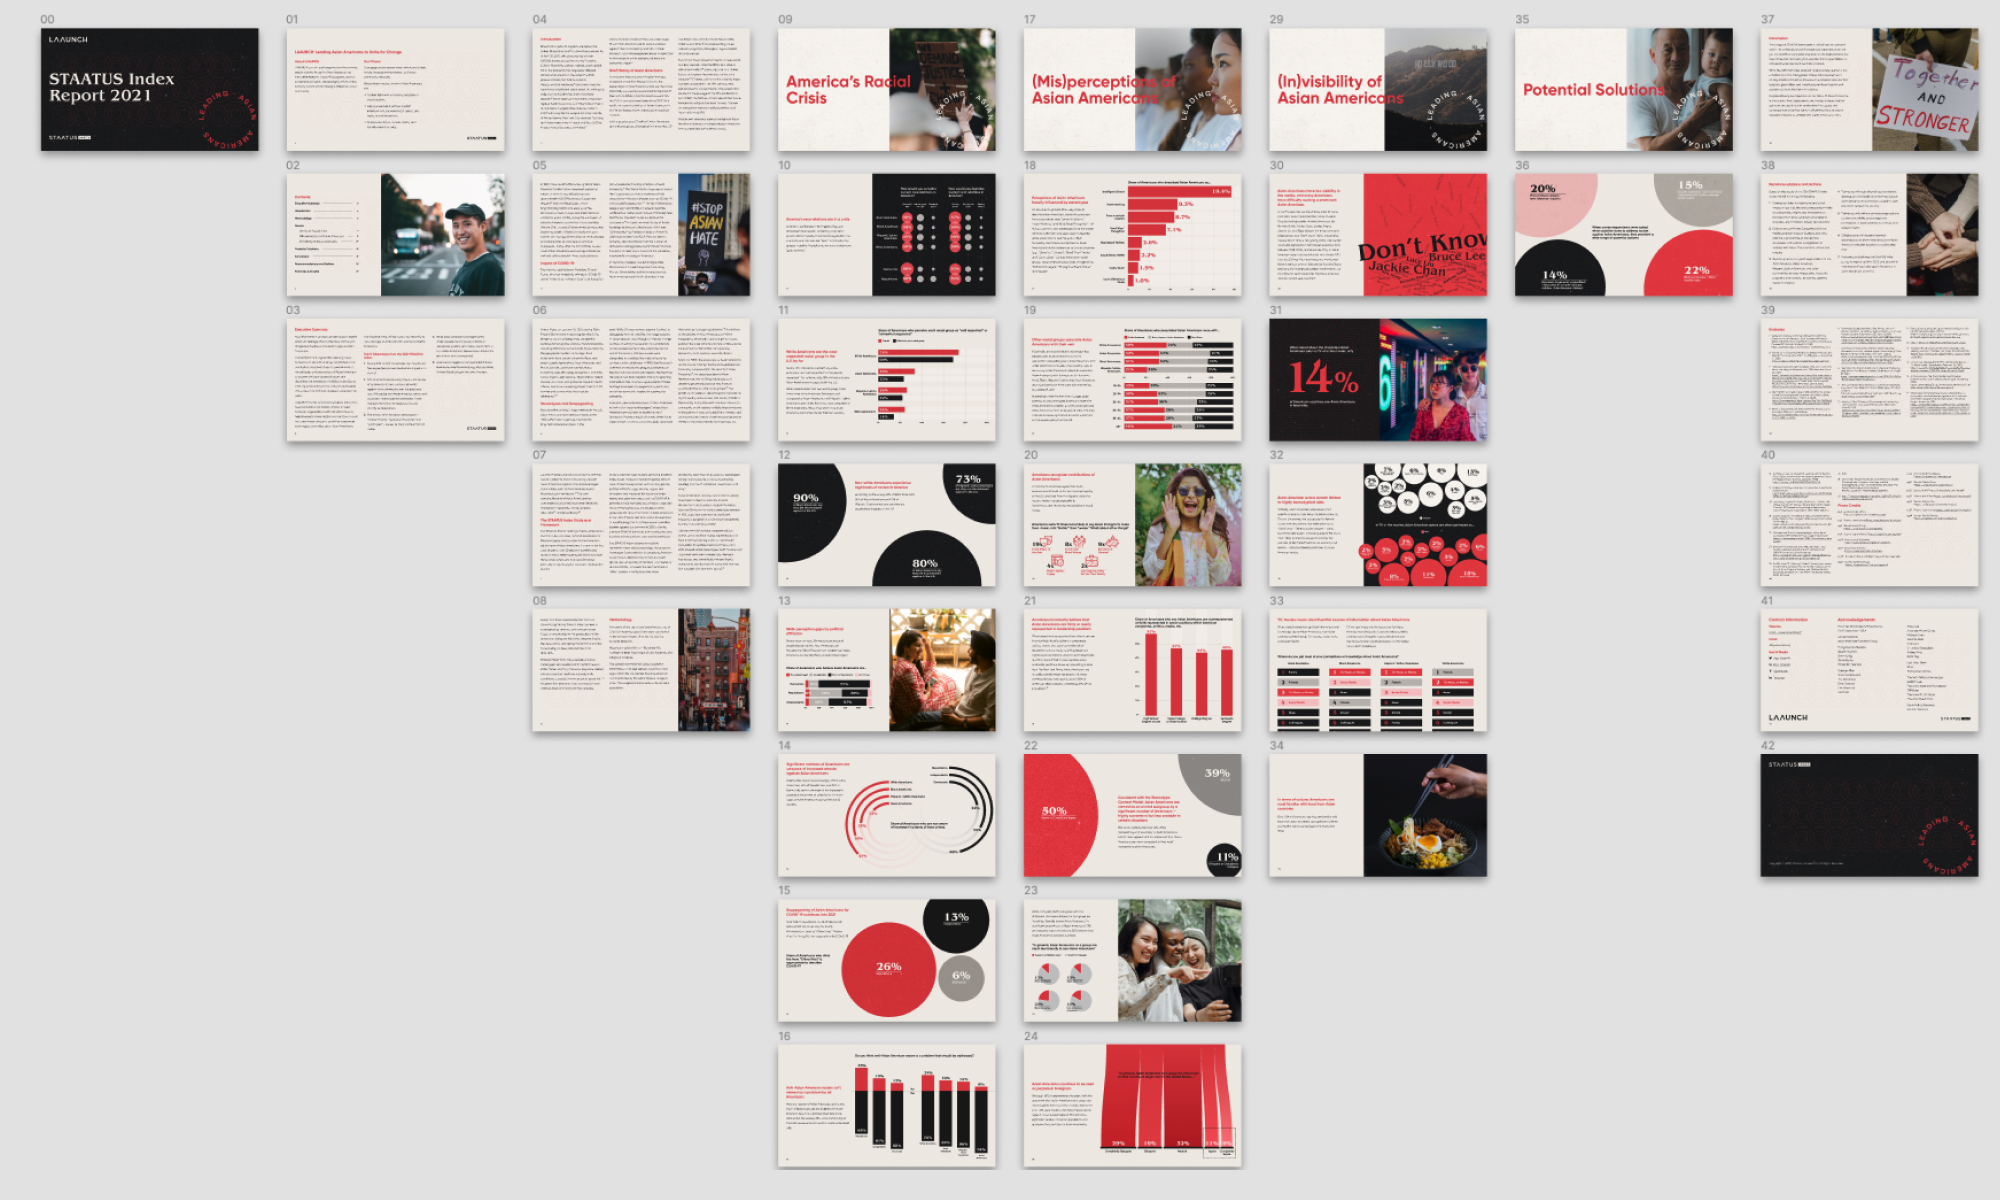
Mockups: The PDF Report
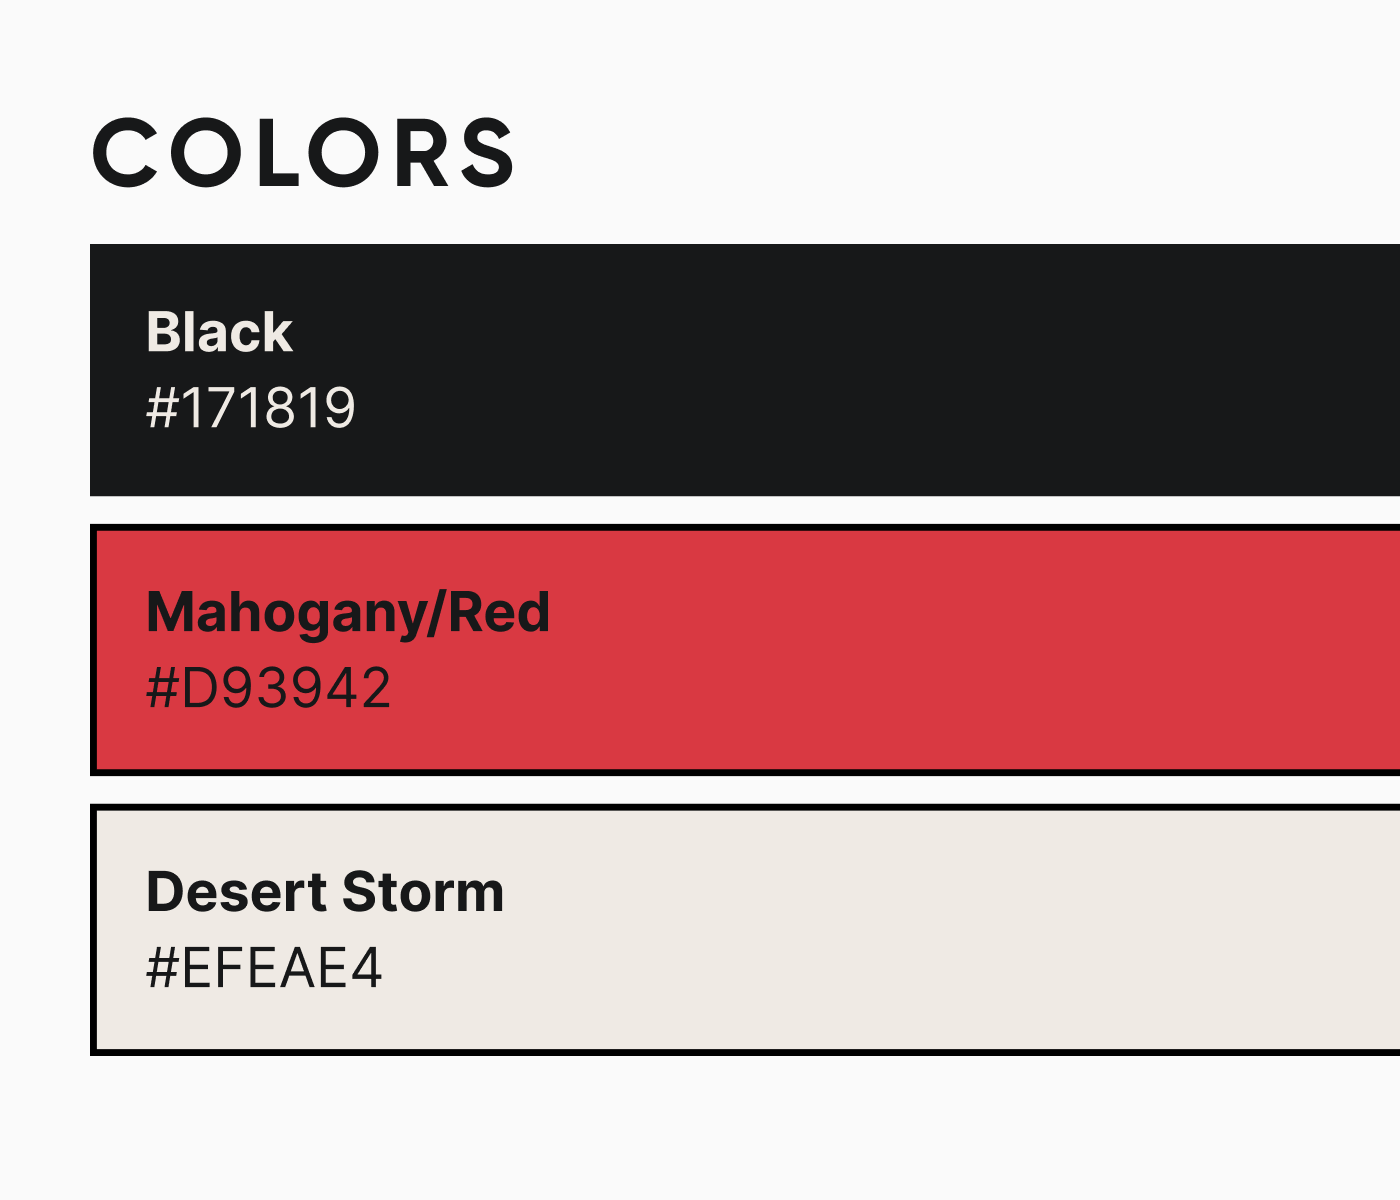
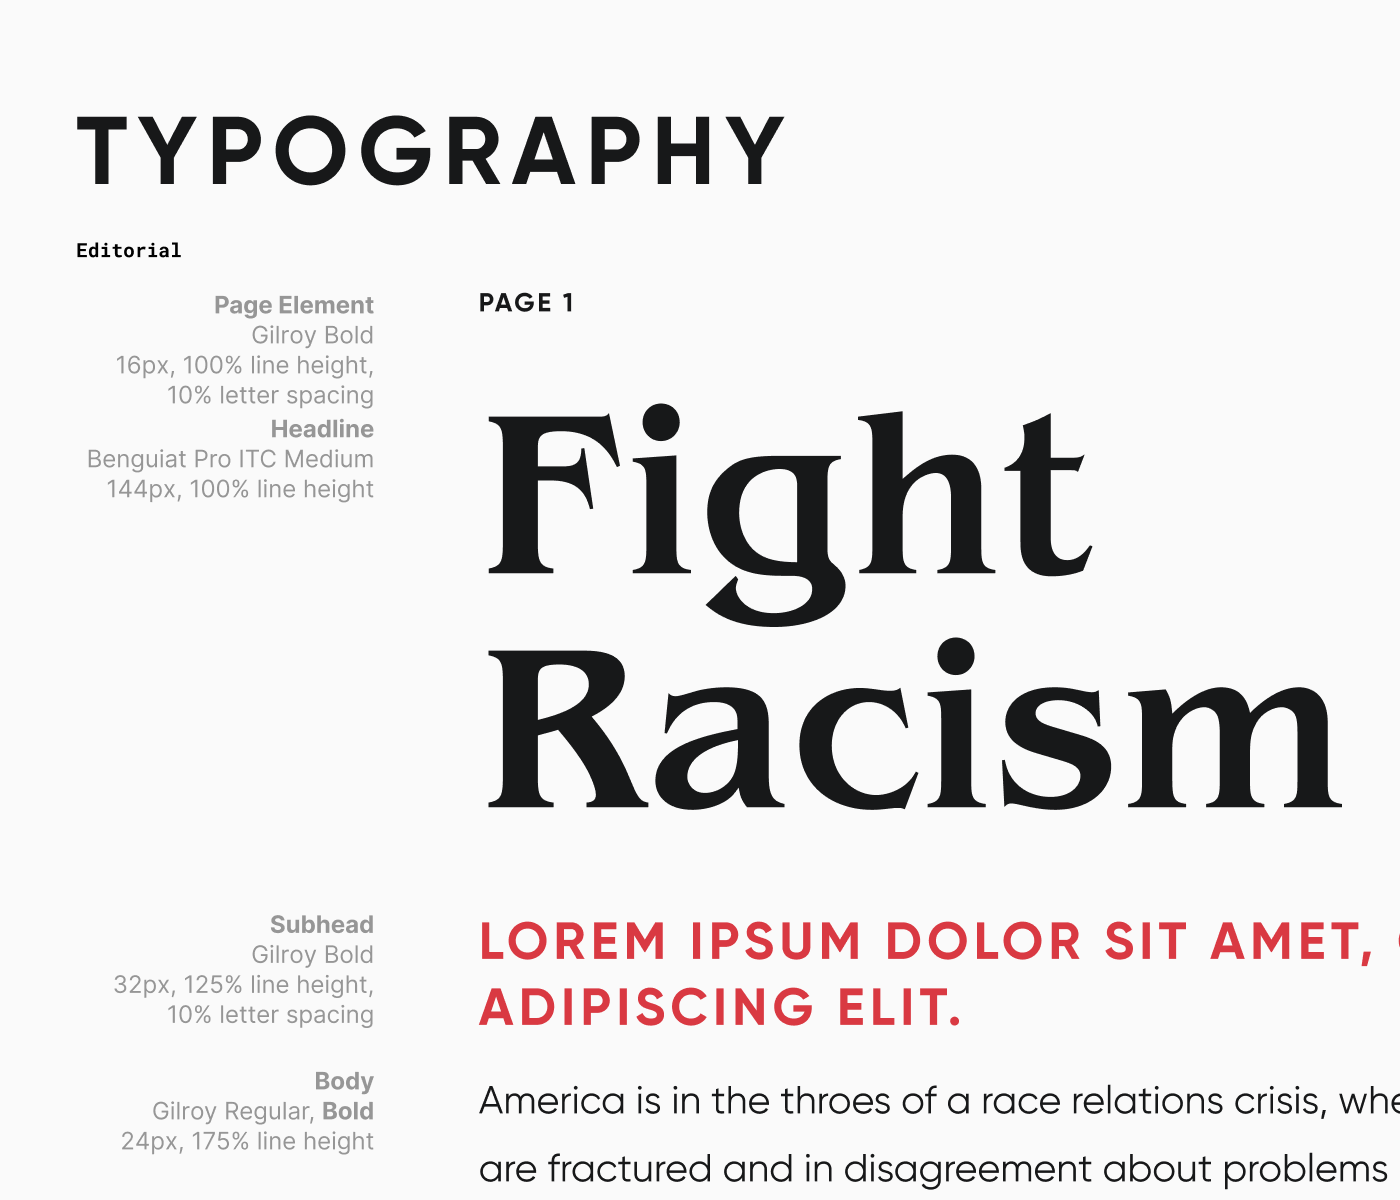
For the PDF report, LAAUNCH asked us to work within the style guidelines they had recently developed for the overall brand. This provided guidance as we began to flesh out the content and aesthetic of each page.
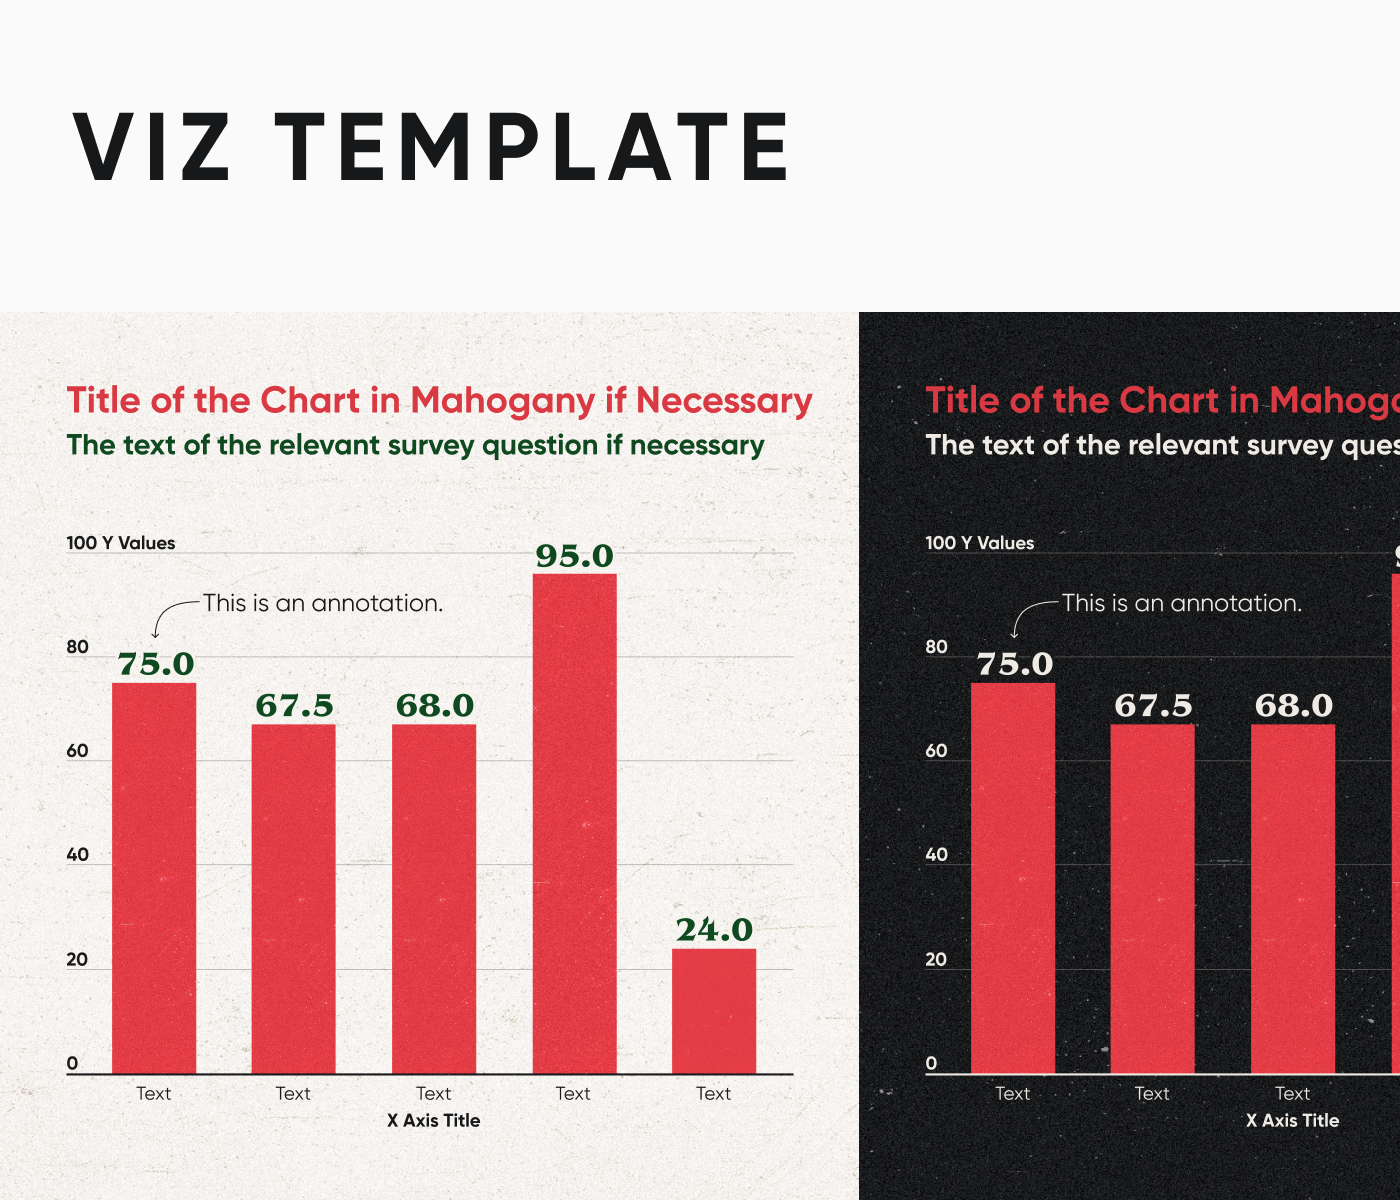
In total, we designed over 40 pages, with 25 prominently featuring data visualization elements. Each page not only needed to be beautifully designed and clear to understand, but also work together cohesively and paint a complete picture of the narrative.
Mockups: The Microsite
Upon completing the PDF report, we dove into crafting the microsite designs. The first step was deciding which insights from the PDF would be most impactful within an interactive site.
We initially brainstormed content layouts in FigJam, and once we were settled on what data points to feature, we mocked up the site in high fidelity using Figma. After soliciting feedback from the client and making minor tweaks, it was ready to build.
Technology
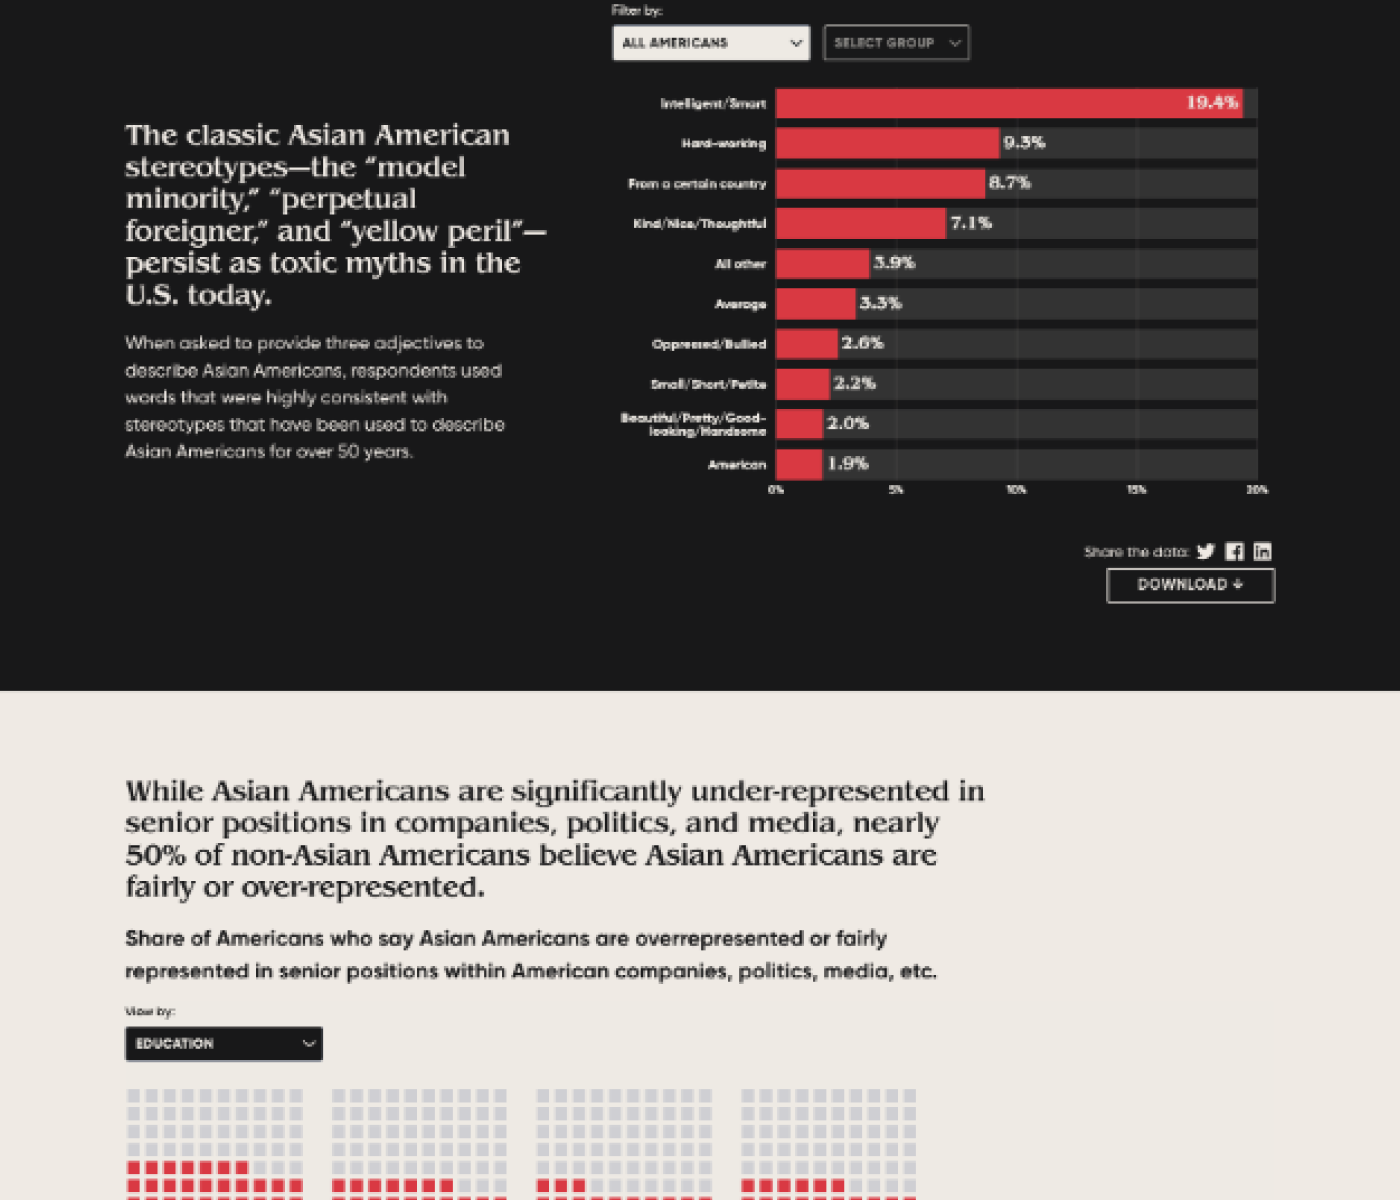
Our team built the frontend for the microsite with Webflow, the same CMS that LAAUNCH uses for its main website. We then combined Webflow's no-code framework with elements of interactive data viz, which were embedded in the page as iFrame elements.
This approach allowed a designer to lay out the microsite in Webflow, while our developers focused on the data viz. Through collaborative efforts between design and development, we were able to expedite the work to meet a tight timeline.
We also designed separate, downloadable assets for users to share via their social media accounts. These assets reflected the key data points from each section within the microsite.
Development Workflow
Development of the entire microsite took approximately three weeks, including work in Webflow and creation of the data viz. In Webflow, we were able to use the existing components from LAAUNCH's main website, like their navigation, footer, and button elements, as well as their typographic scale.
Using Svelte and D3.js, our team also developed interactive visualizations. Each chart was made with custom code to match LAAUNCH's brand aesthetic, incorporate slick transitions, and look beautiful on desktop, mobile, and tablet. We hosted these visualizations on a separate domain during the development process for LAAUNCH's to review our progress and iFramed them into the Webflow site once completed.
Deployment
We used a subdomain to host the STAATUS Index microsite off of LAAUNCH's main website (https://staatus-index.laaunch.org/). We deployed the site through Webflow with the help of LAAUNCH's web designer, Kim Granlund. Kim also helped ensure that everything we built was visually consistent with the broader site.
Thanks to the entire DataFace squad for all the fabulous work! As many have commented, a key part of our success thus far has been the data visualization and clarity of the results.
Norman Chen
CEO, LAAUNCH
Press
The broad reception of this project by the media and broader public was astounding. It was mentioned in outlets such as Axios, Fortune, NPR, and NBC, to name a few. It was also cited by TV personalities like John Oliver and Stephen Colbert in segments on their late night shows. A more in-depth overview of the press coverage can be found here on laaunch.org.

Project Contact
Jack Beckwith
Contact Jack if you’d like to learn more about the project or ways that The DataFace can help your business.
(650) 353-0774