
Client Work Case Study
Why We Run
Background
Strava is a fitness app and social network that enables millions of runners, cyclists, and performance athletes to track their progress and connect with others. With access to such a large group of avid runners, Strava is uniquely positioned to conduct research on the factors that motivate people to start running and to continue with the sport. Strava saw this as an opportunity to deepen its understanding of the running community and engage its users.
Strava hired Imprint Projects to lead strategy and execution of their “Why We Run” marketing campaign. Imprint assembled a team that included qualitative and quantitative researchers, including Blair Evans, Ph.D., Asst. Professor of Kinesiology, Penn State University to author a white paper. The DataFace team played the role of the data viz partner, tasked with combining qualitative research and quantitative survey results into a compelling, interactive narrative.
Project Details
Client

Date
October 2019–February 2020
Audience
Strava’s users / the running community at large / members of the press.
solution
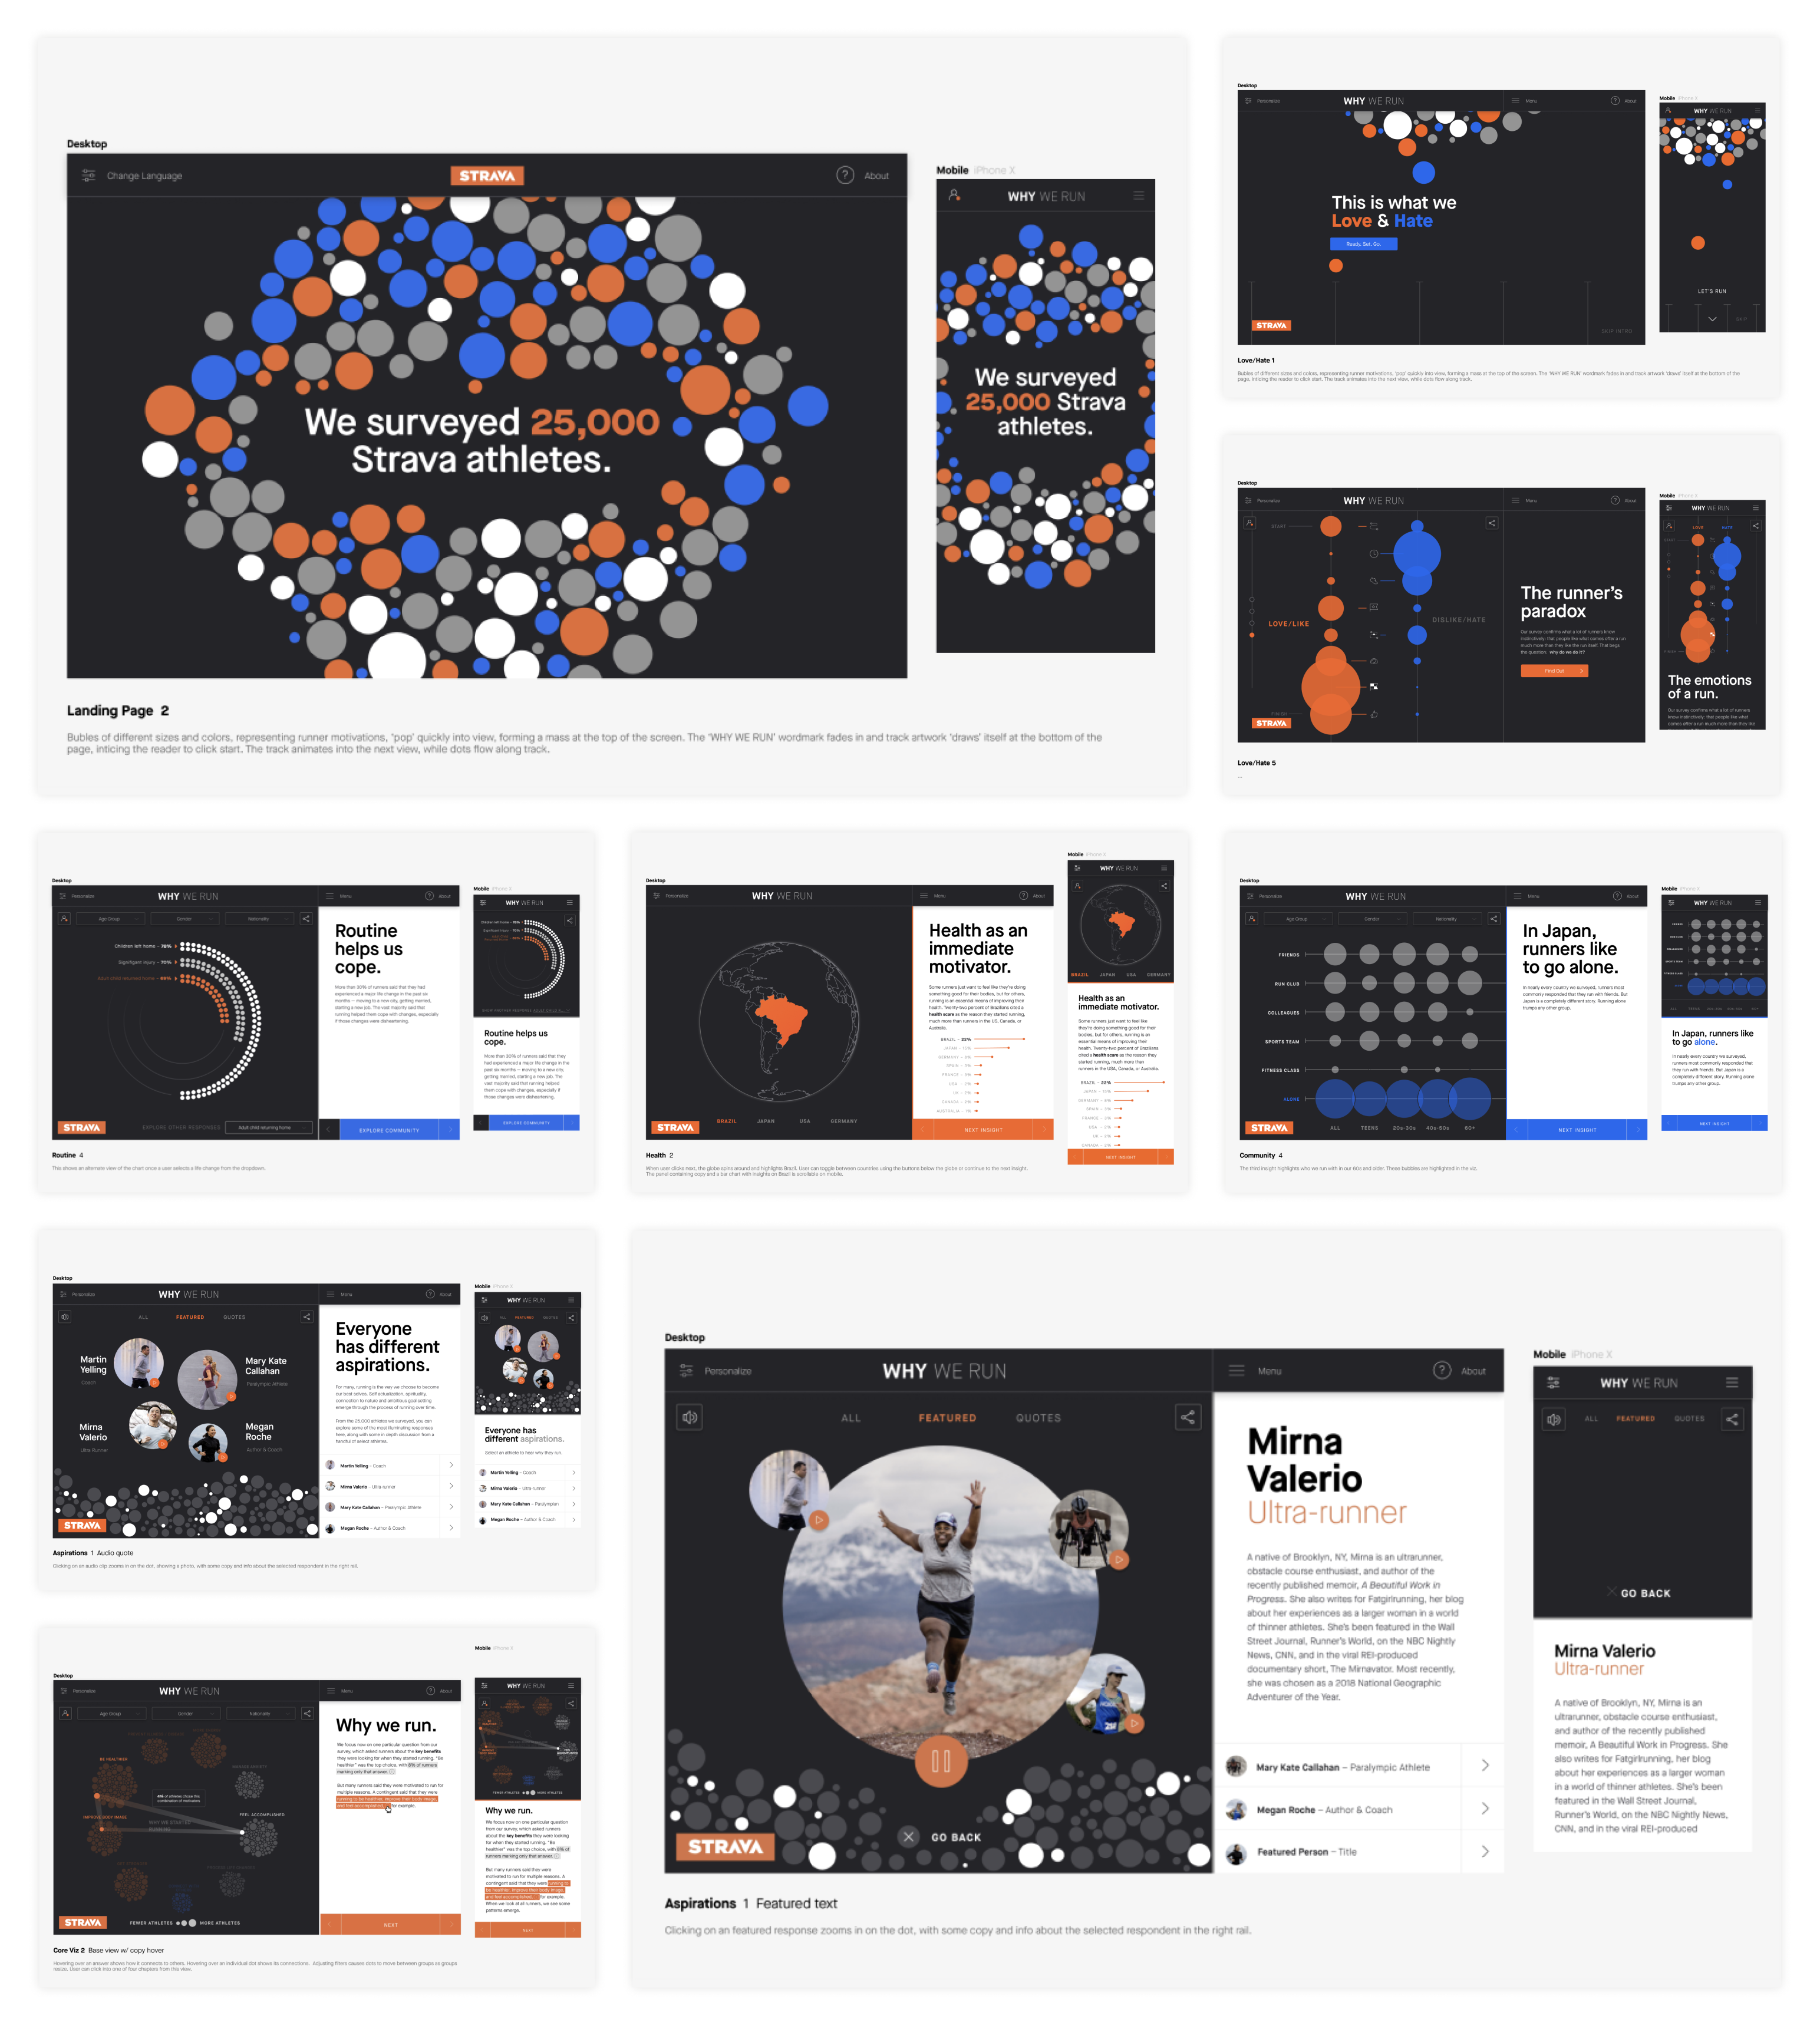
A microsite hosted on Strava’s website that highlights the most salient insights from the research. The microsite features plenty of interactive visualizations, along with downloadable versions of all charts for press. Readers can explore the experience in six different languages, catering to each of Strava’s major markets.
Result
Strava loved the microsite and invested heavily in its promotion. The marketing team drove Strava users to the page through a series of email campaigns and in-app promotion. The microsite was shared widely on social and netted mentions in Reuters, The New York Times, Runners World, Vice, Bustle and more.
Project Goals
Drive awareness for the Strava brand by showcasing original research on runner motivations.
Drive user acquisition and conversion for the Strava app.
Contribute to the field of sports psychology and our understanding of runners’ needs in a meaningful way.
Research Methods
Qualitative Interviews
Imprint organized a series of three-hour, one-on-one interviews with 24 runners. The respondents were men and women from either the United States or United Kingdom.
Quantitative Survey
Strava administered an online survey to 25,000 of its users, who were invited via email and the Strava app. Respondents were drawn from nine markets -- Australia, Brazil, Britain, Canada, France, Germany, Japan, Spain, and the U.S.
The survey consisted of over 50 open-ended and multiple choice questions about the drivers of running motivation. The data derived from the survey would serve as the basis for most of the interactive data viz on the microsite.
In-Person Workshop
In October 2019, members of the Strava, Imprint, and DataFace teams met to review the research findings and brainstorm about the narrative. The qualitative research had already identified five core needs for runners -- stability, self-awareness, control, belonging and realization.
In a series of discussions and group activities, the teams identified additional patterns from the quantitative and qualitative data that fit within this framework.
Design
The first step for our team was to thoroughly review the survey data. We performed our own analysis in Tableau, summarizing the results from each question and cross-tabulating multiple questions to unearth patterns in the responses. We also had demographic information about each runner, including age, gender, and country of origin, so we looked to see how responses varied across demographic groups.
Concepting
Once we examined the survey data in detail, we turned our attention to outlining the interactive experience at a high-level. We offered two, alternative “visions” for the experience to Strava and Imprint: one was a more traditional data story and the other a “choose your own adventure” style experience.
We provided two examples to demonstrate the differences in each approach: the first was this project from OpenNews (which we developed back in 2017), and the other was this game from Bloomberg about Brexit.
Strava gravitated towards the traditional data story, especially because the nature of our data was similar to that of the OpenNews project. Still, Strava emphasized a desire to have multiple “tracks” through the project, allowing the reader to delve deeply into insights that interested them and skip over others.
Mockups
We did four rounds of mockups with Strava, each higher fidelity than the last. We used Strava’s fonts, color palette, and iconography, so that the project could live naturally on Strava’s website.
We collaborated closely with Brinson McGowan, a Senior Designer on Strava’s team, during this phase of the project.
Story Flow
One of our biggest challenges was to sift through all the research -- hours upon hours of transcripted interviews, results from 50+ survey questions -- and identify the most salient points.
We decided to start the narrative by highlighting a juxtaposition. Most survey takers (63%) claimed that they “definitely enjoyed” running. But when asked about specific stages of a run -- the first mile, the midpoint, running uphill -- few people reported that they actually loved any of them. So if runners merely tolerate the physical act of running, why do they keep coming back to it?
It was a perfect “hook” to set up the rest of the experience. We honed in on two questions from the survey that spoke very directly to that question and to the impetus of the research.
Question 15
What benefits were you looking for when you started running?
Question 16
Which running benefits are you looking for currently?
We wanted these questions to underpin the project because:
They touched on themes already identified in the qualitative interviews, and allowed us to attach hard data to them.
The questions allowed for multi-selection, meaning that we could understand the degree to which motivations were connected.
Question #15 spoke to past motivations while #16 spoke to present motivations, allowing us to assess how running motives evolve over time.
We used data from questions #15 and #16 to design what we dubbed the “core visualization”.
We divided the rest of the experience into four “chapters”, based on themes identified through the research. Each chapter covered a deep-seated desire that running helps fulfill -- improving health, finding community, establishing routine.
The final chapter focused on the aspirational piece of running and its role in guiding people towards self-actualization. Instead of reporting out more stats from the survey, we decided that the most powerful way to present this information was by letting runners speak for themselves. So we sifted through hundreds of open-ended responses from the survey and added audio clips from in-person interviews. The result was something honest and raw.
Technology
The project’s frontend was built using HTML, CSS, and vanilla Javascript. Our team developed the experience for mobile, tablet, and desktop screens, and ensured it worked seamlessly on all modern browsers.
We relied heavily on D3.js to build the report’s numerous custom data visualizations, and made use of native CSS transitions throughout to create the full, interactive experience. We also leveraged TopoJSON, a library used for compressing topographic data, to build the performant 3D globe seen in the “Health” section of the microsite.
A particularly challenging feature was to make the whole experience available in six different languages. We leaned on Strava’s translations team to translate copy across the project and used URL parameters to swap out text when the user selected a different language.
Development Workflow
Our team worked over a six-week timeline to develop the microsite. Two of our developers coded collaboratively via GitHub, and shared a live development link weekly with the Strava team to monitor our progress and watch the project come to life.
Towards the end of the development process, we opened up the project to Strava stakeholders across the globe to participate in a final round of testing. Over two weeks, our team triaged feedback on design tweaks, bugs, and translation updates from stakeholders, and implemented fixes to address the issues they identified.
Deployment
We worked closely with members of the Strava engineering team to deploy the microsite on a custom subdomain. Our developers built a custom process to migrate the production code to AWS, and helped integrate analytics and tracking software throughout the page.
Results
Strava started pitching to the media during the week of February 10, 2020 and publicly revealed the microsite on February 19. The response was immediate. Hundreds of athletes began sharing the microsite on Twitter, with screenshots of the charts or findings that particularly resonated.
Tier 1 outlets like Reuters, The New York Times, Runners World, Vice, and Bustle wrote about the research, along with major media in Japan, Spain, and France. Overall, Strava landed 150+ press pieces.
Strava continued to drip out static images from the project on its official Instagram and Twitter accounts over the coming weeks. Together, the posts amassed almost 30,000 likes on Instagram alone.
The sentiment on our social channels was incredibly positive… [W]e saw 99% positive engagement on owned channels and really thoughtful reactions on Twitter.
Annie Vranizan
Director of Global Marketing for Strava
Project Contact
Jack Beckwith
Contact Jack if you’d like to learn more about the project or ways that The DataFace can help your business.
(650) 353-0774