Nov 2018
When and Where are Wildfires Most Common in the U.S.?

It’s been a recording-setting year for wildfire activity, especially in California. First, the Mendocino Complex Fire consumed over 459,000 acres between July and September 2018, becoming the largest recorded fire in the state’s history. Then, just a few months later, the Woolsey Fire and Camp Fire emerged in opposite corners of California, the latter of which has already claimed the lives of 81 people and destroyed over 17,000 structures. It flattened almost the entire town of Paradise, a retirement haven in Northern California home to nearly 26,000.
California has suffered the brunt of U.S. wildfire destruction in 2018. But historically, states like Alaska and Idaho have also been on the receiving end of massive wildfires that wreak havoc on local communities. According to data compiled by U.S. Forest Service, both states saw more of their acreage burned at the hands of wildfires than California between 1992 and 2015.
To get a better understanding of the areas of the country most susceptible to wildfire damage, we’ve created the following map using the U.S. Forest Service’s data. It shows the share of each county’s acreage that’s been burned by wildfires since 1992.
Where Wildfires Start in the U.S.
% of acres touched by wildfires, 1992 - 2015
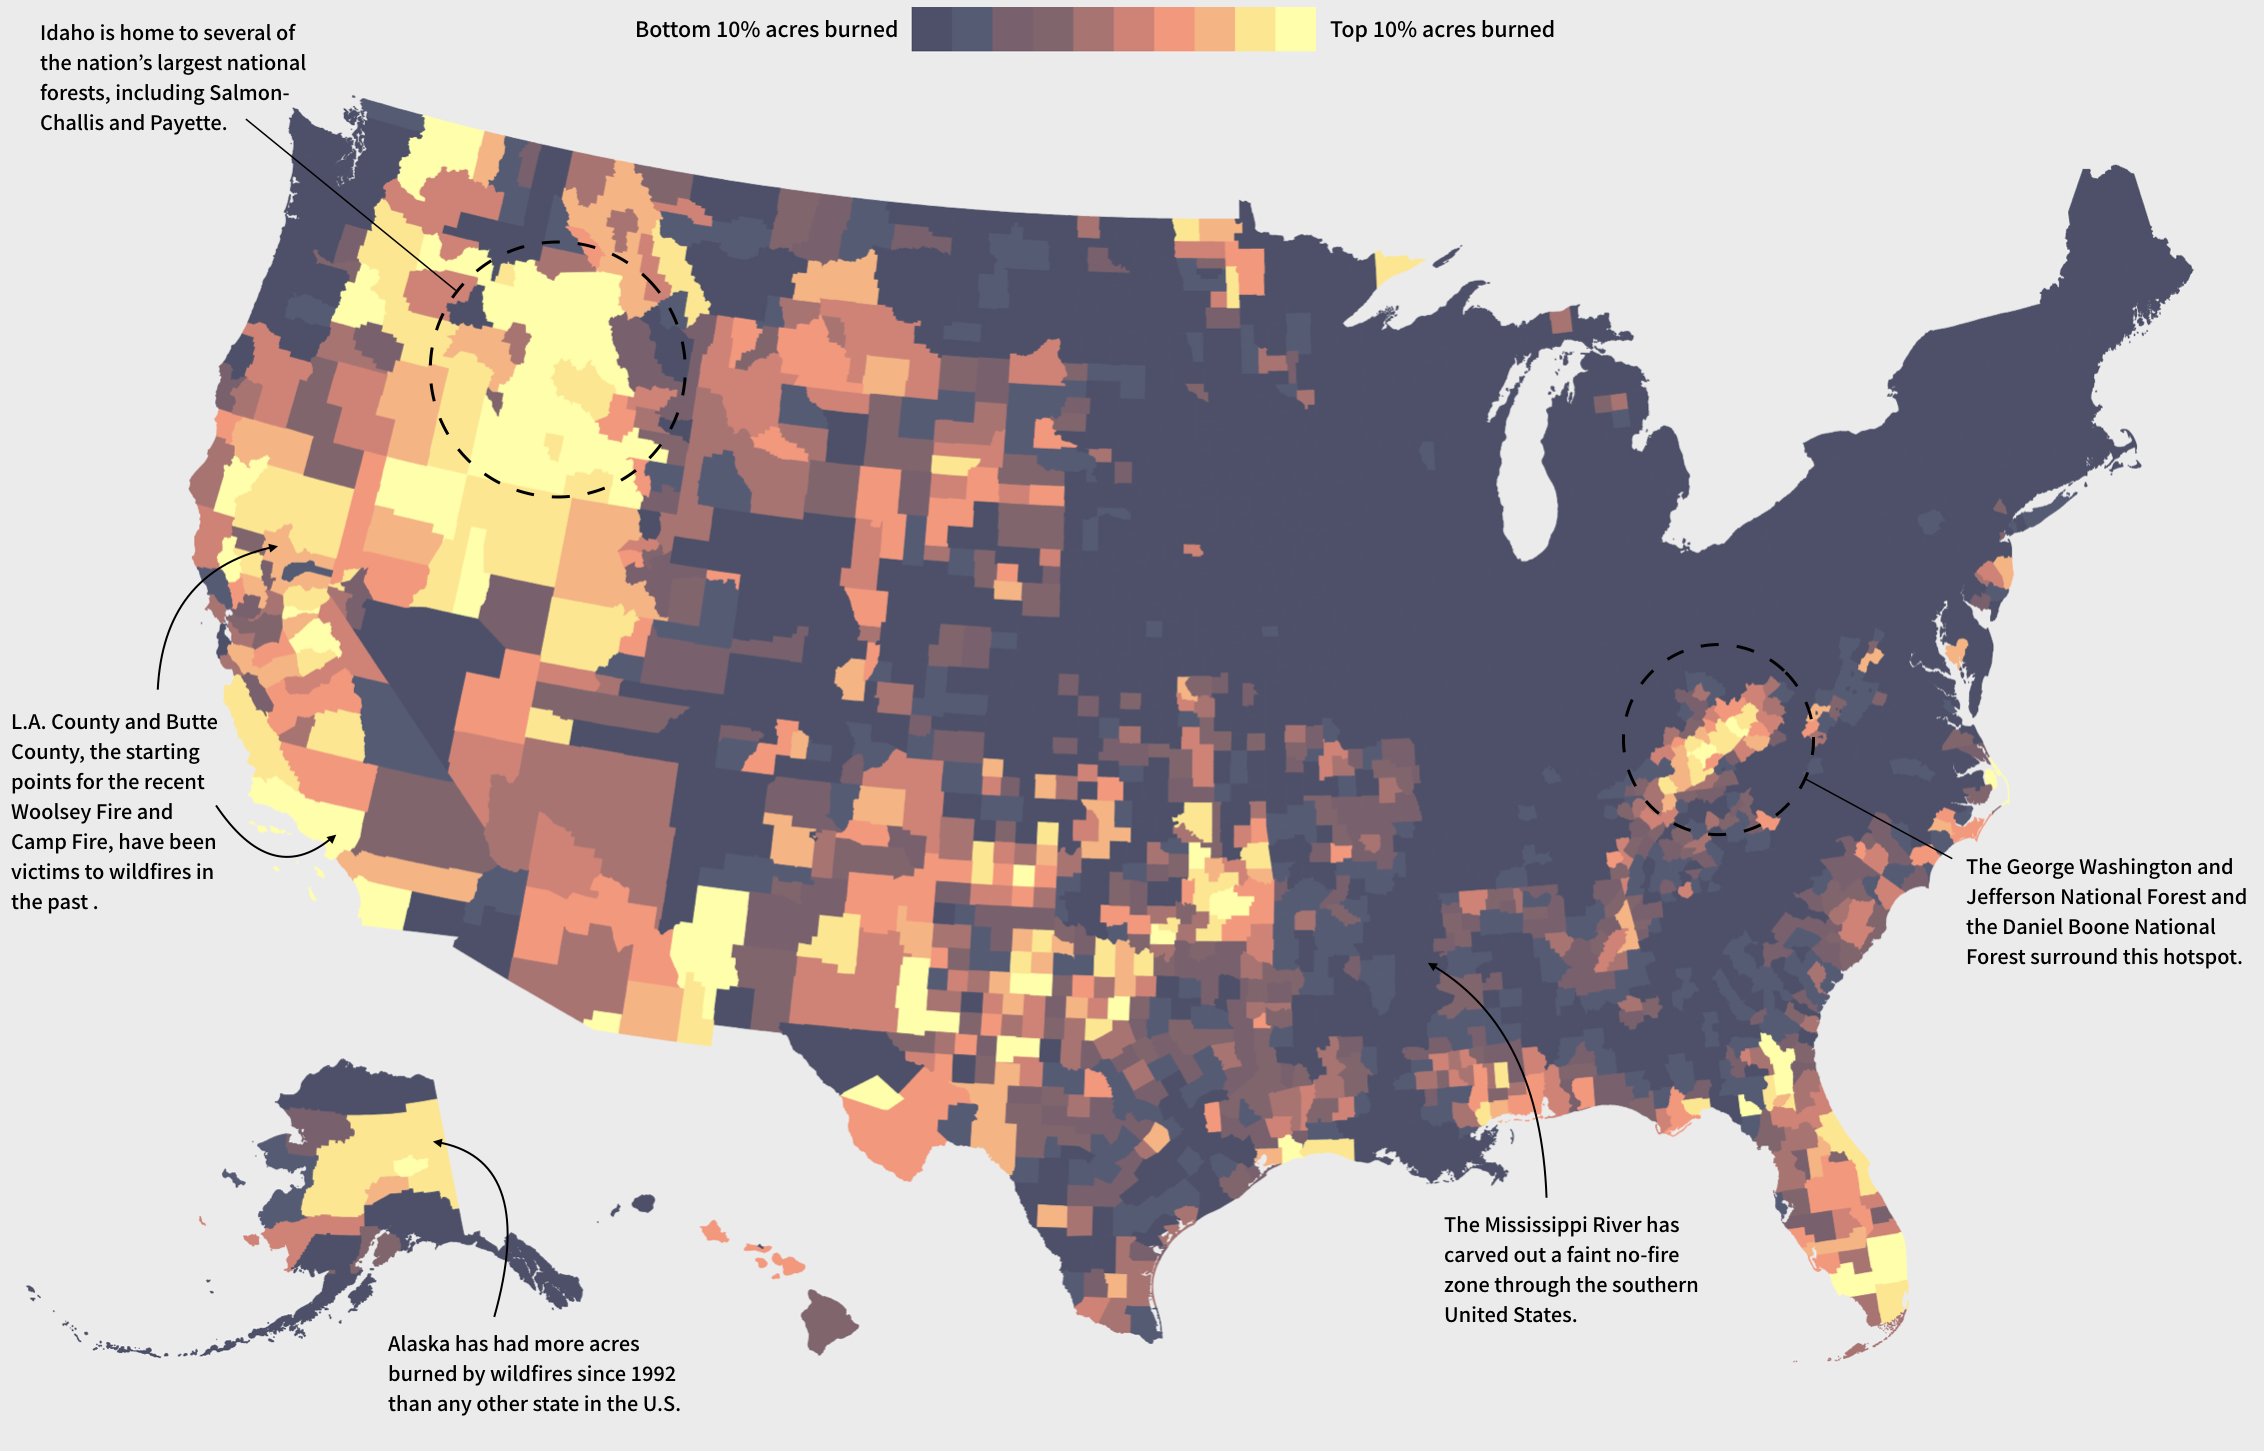
The data mapped above encompass over 1.88 million wildfires across a 24-year period, compiled with information from federal, state and local fire organizations. And while most of the wildfires in the data are small — over 85% burned fewer than 10 acres — they still account for more than 140 million acres burned collectively.
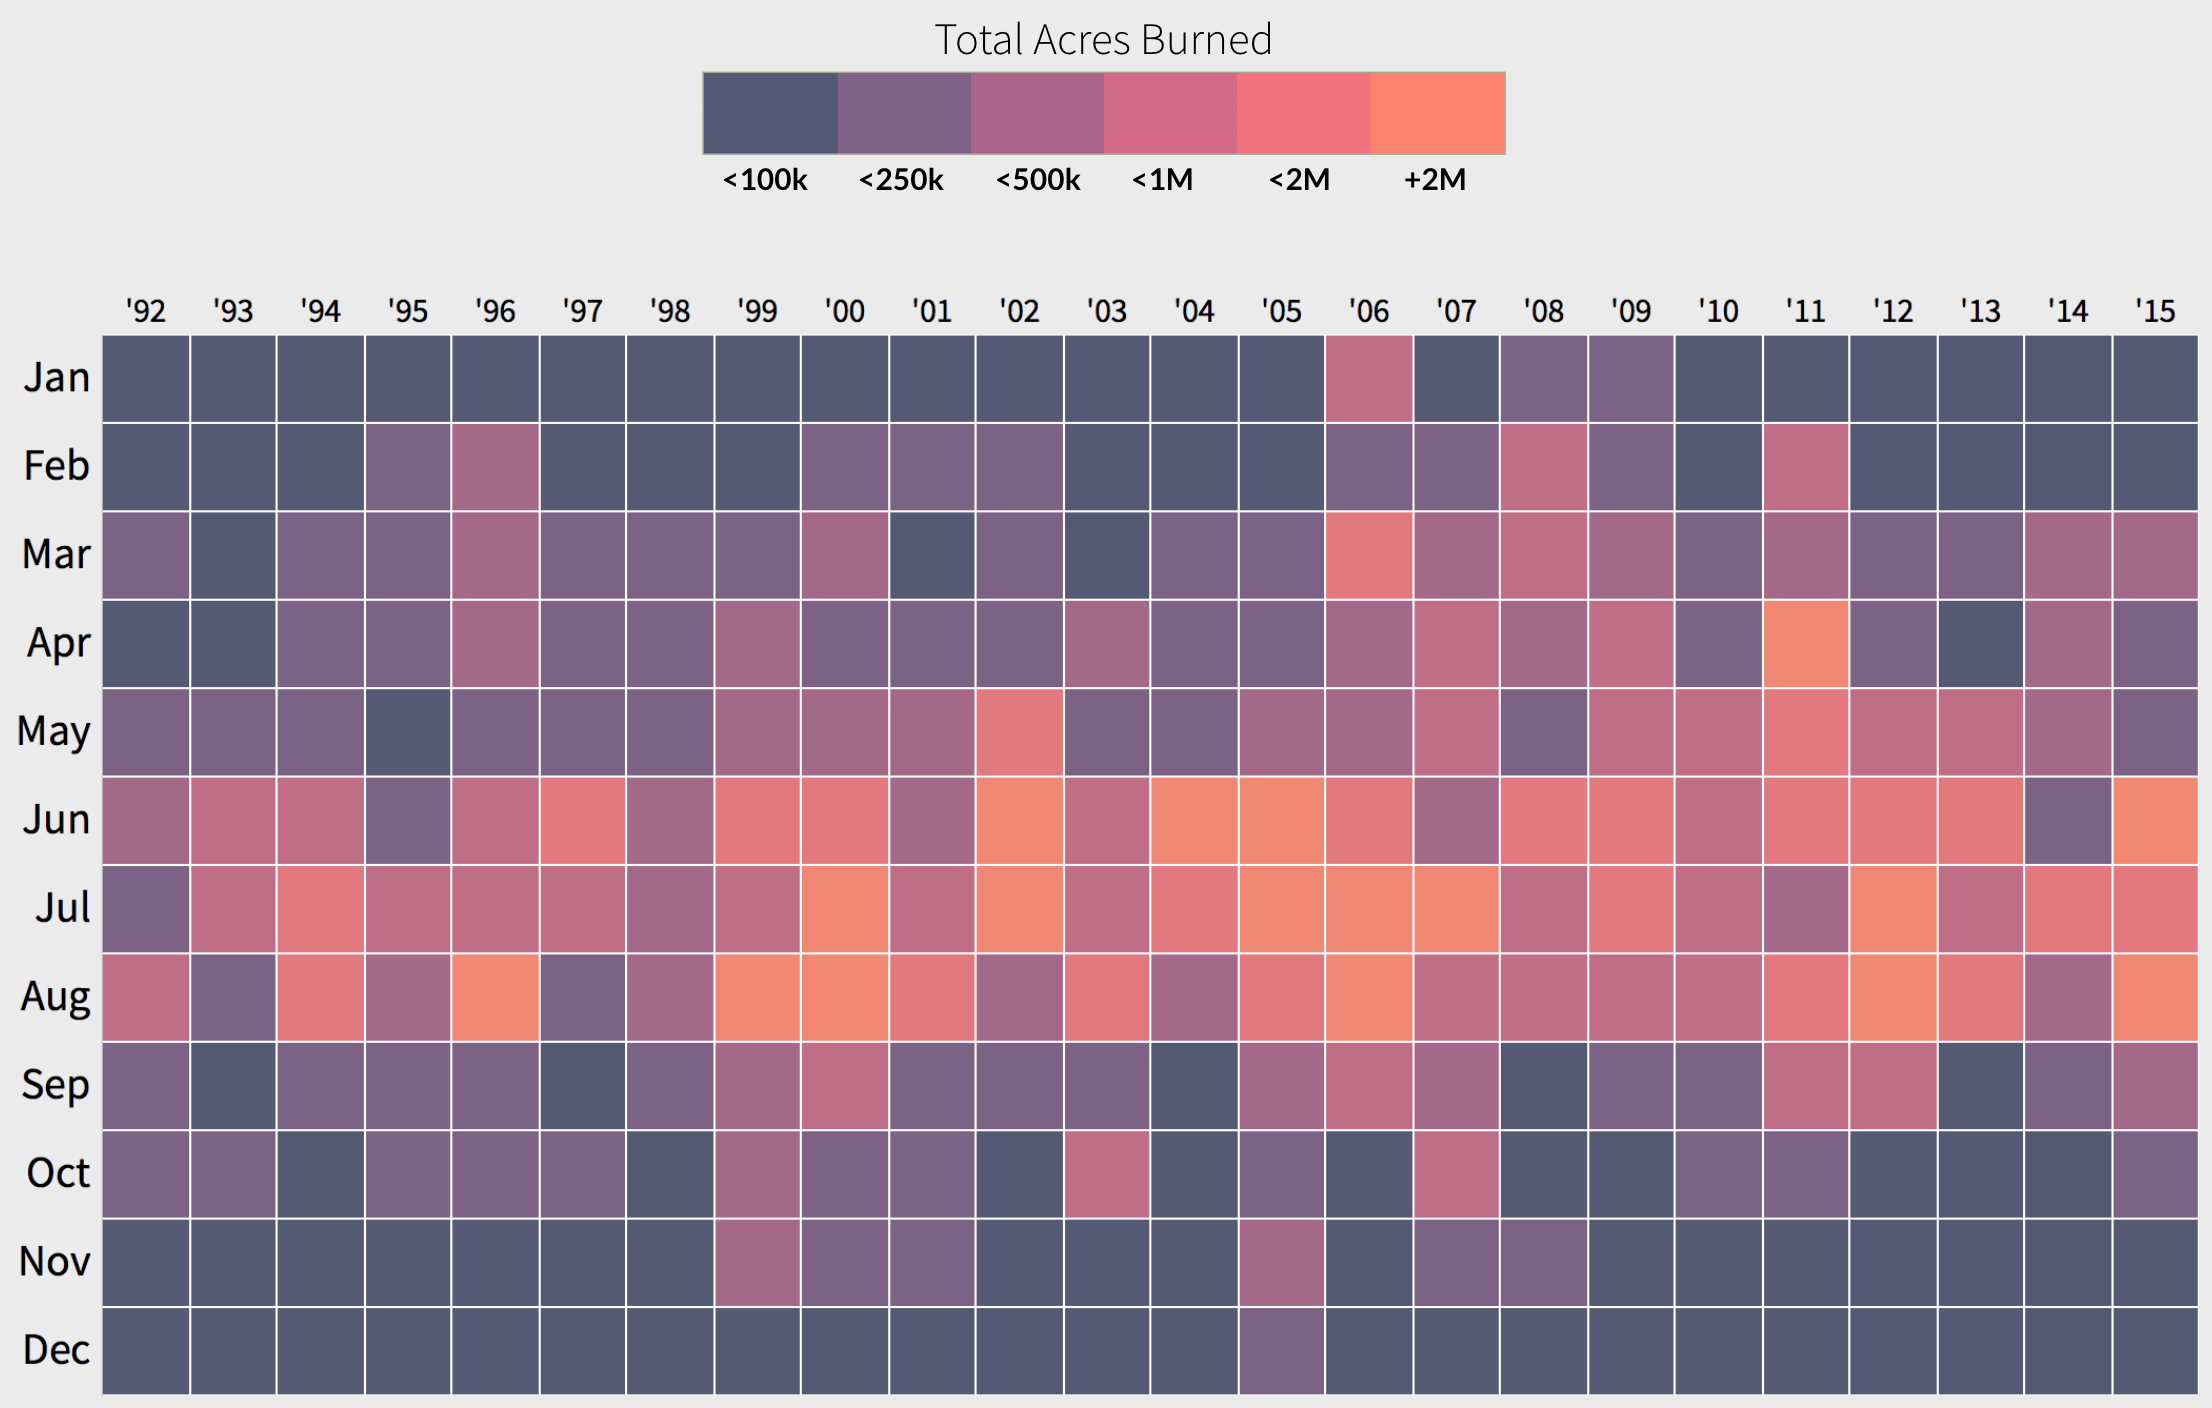
The data tell us not only where fires are happening, but when they’re happening as well. June through August tends to be the high point of wildfire season in most years nationally. The only recent year in which the peak month didn’t fall within that window was 2011, when a host of wildfires in Texas caused Governor Rick Perry to declare 252 counties as disaster areas.
Peak Wildfire Season is in the Summer
Seasonality of Wildfires in the U.S., 1992 - 2015
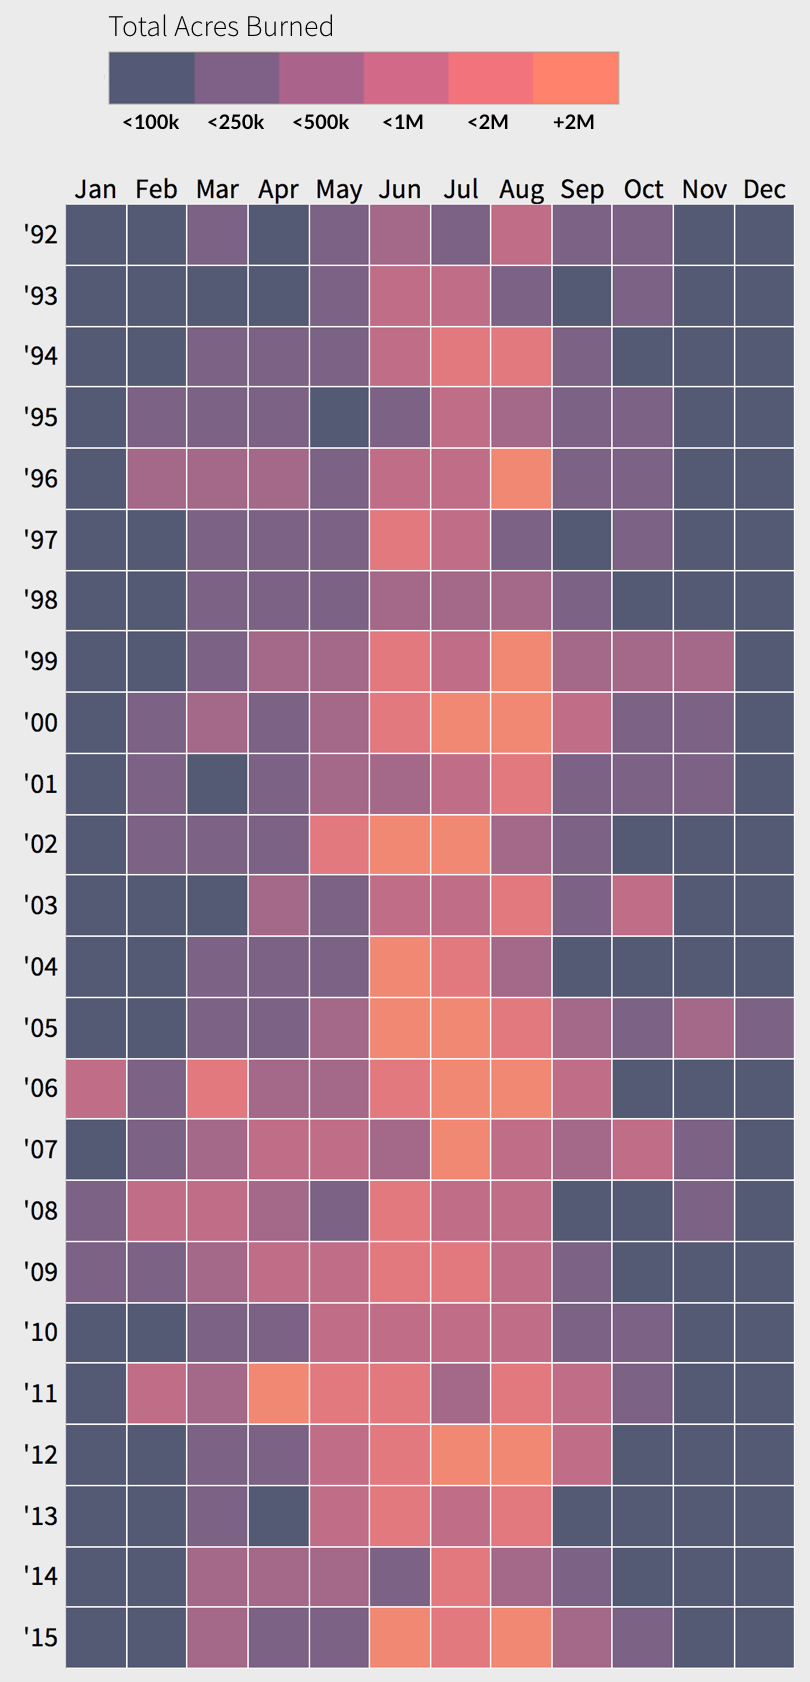
Analyzing wildfire trends at the state level presents a slightly more nuanced picture. Between 1992 and 2015, more acres burned across the U.S. in June than any other month. That was driven largely by wildfire activity in Alaska, where over 20 million acres were consumed in June alone.
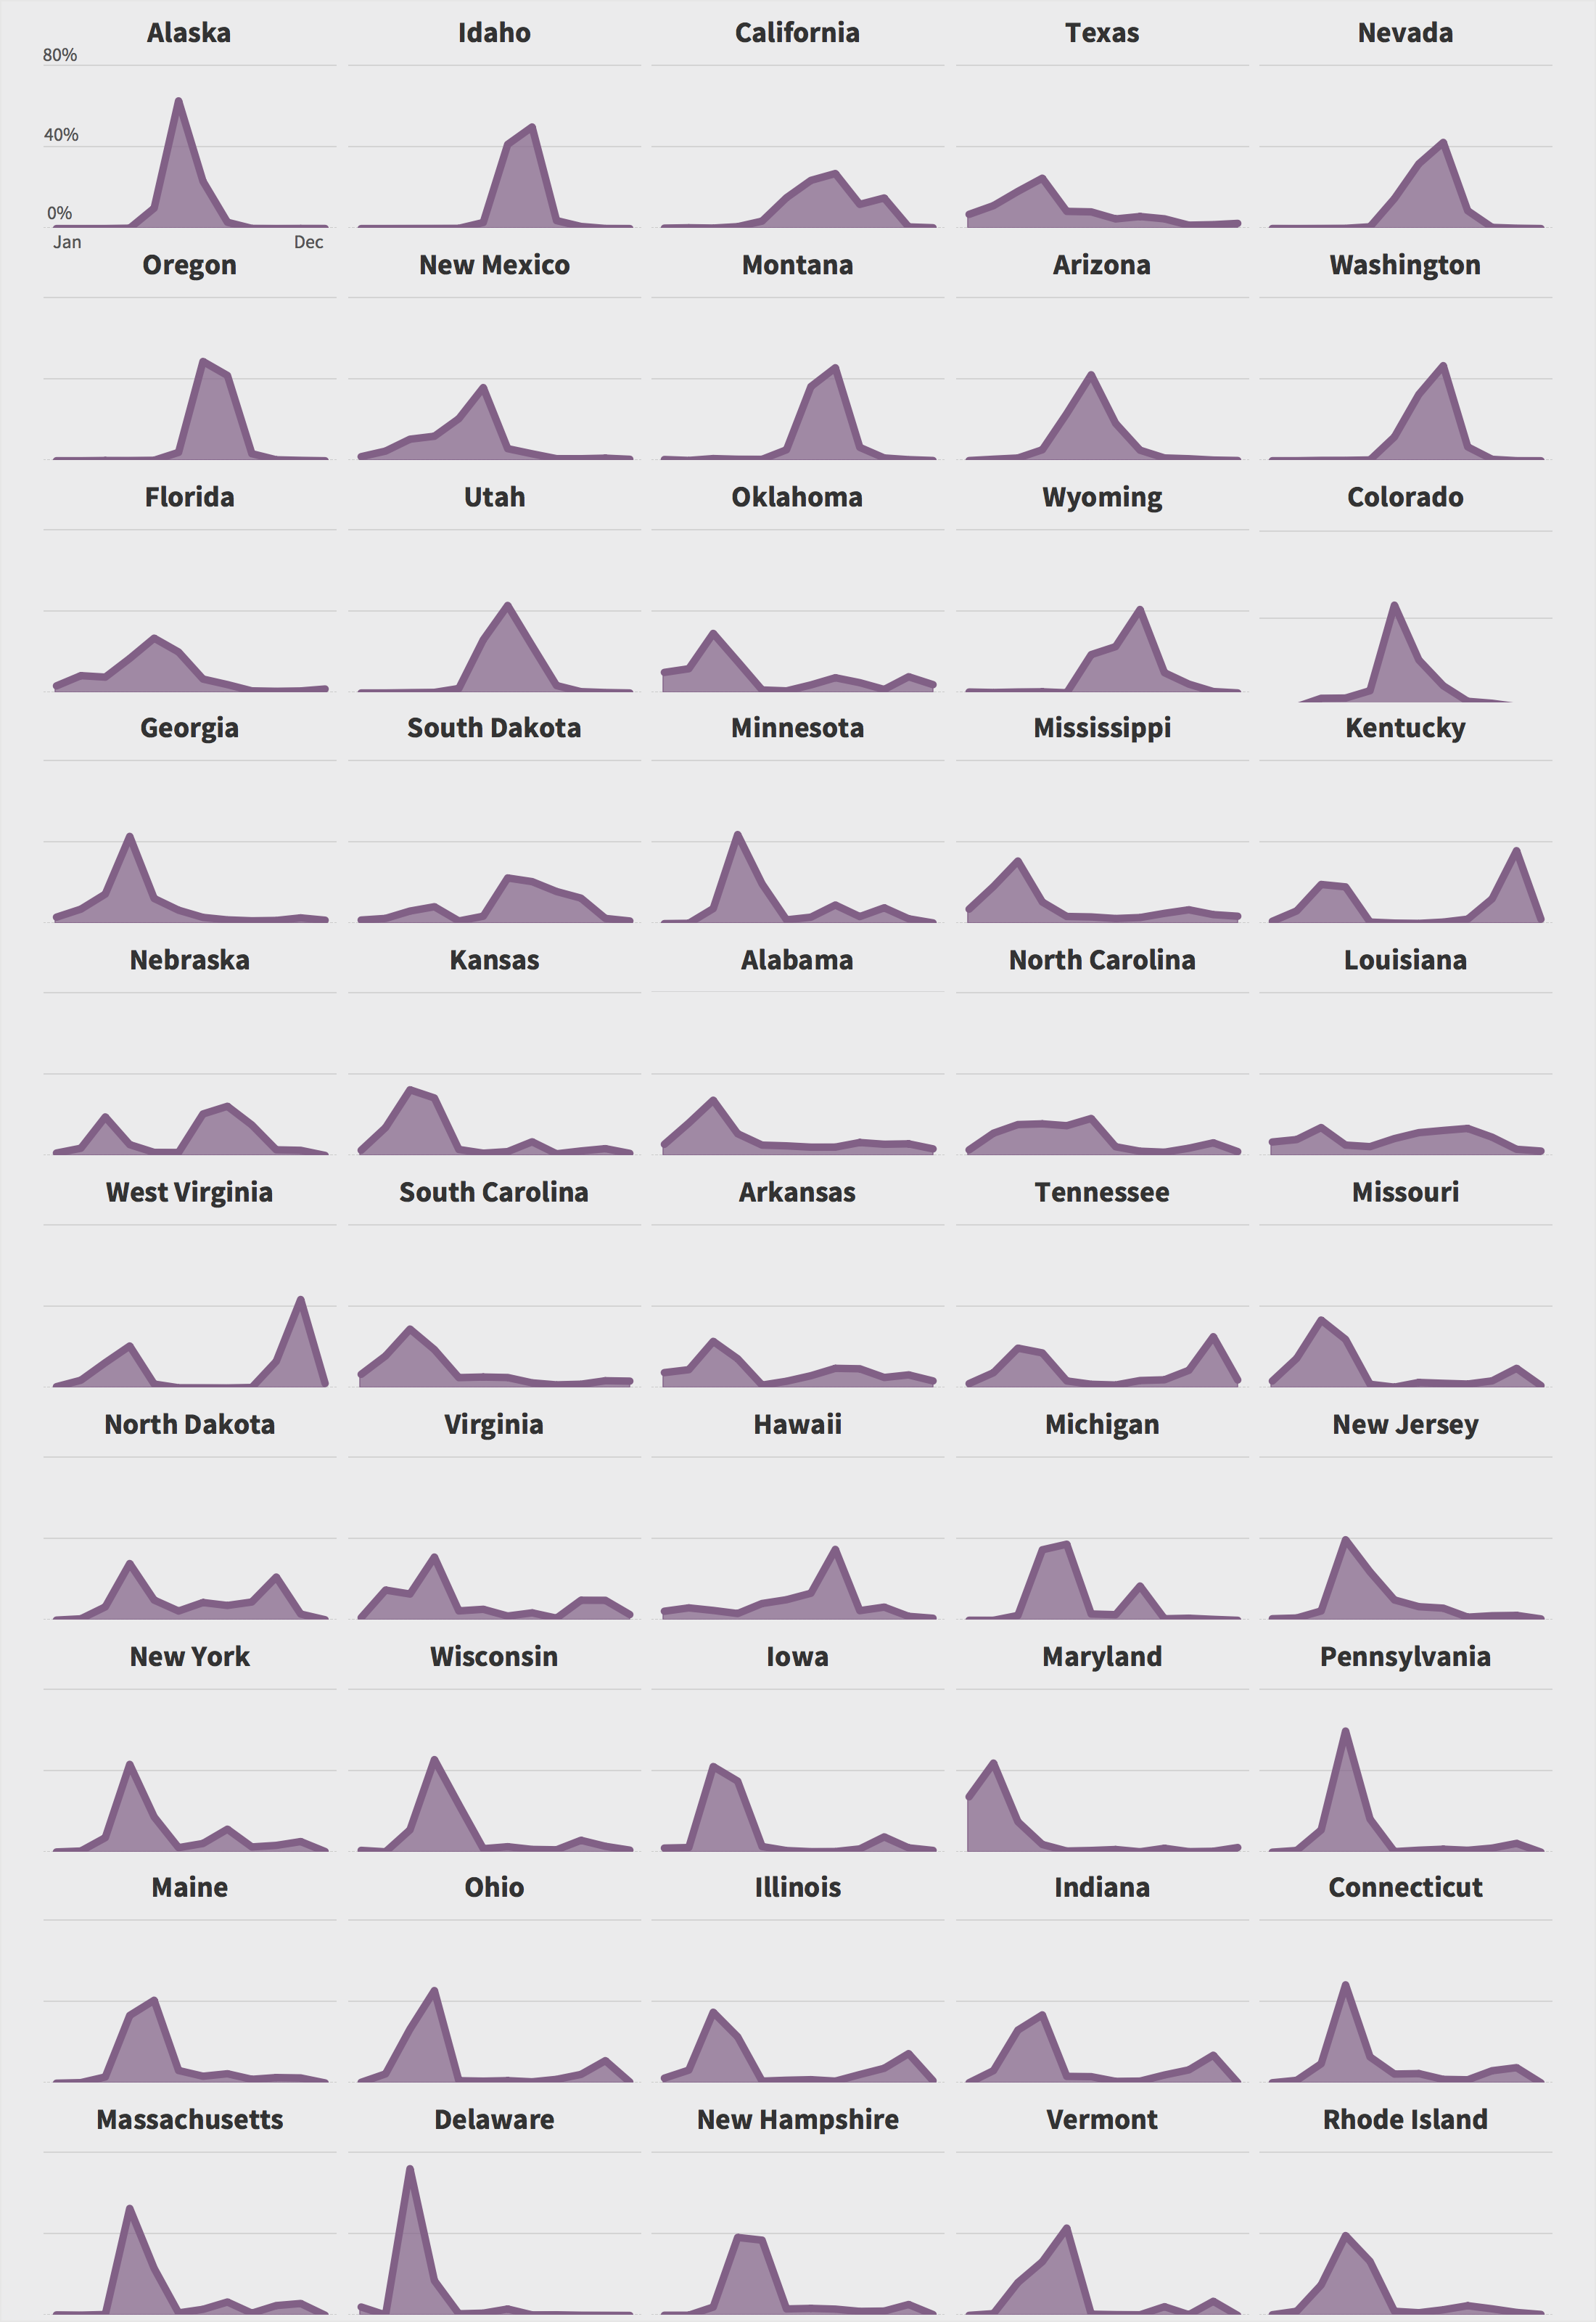
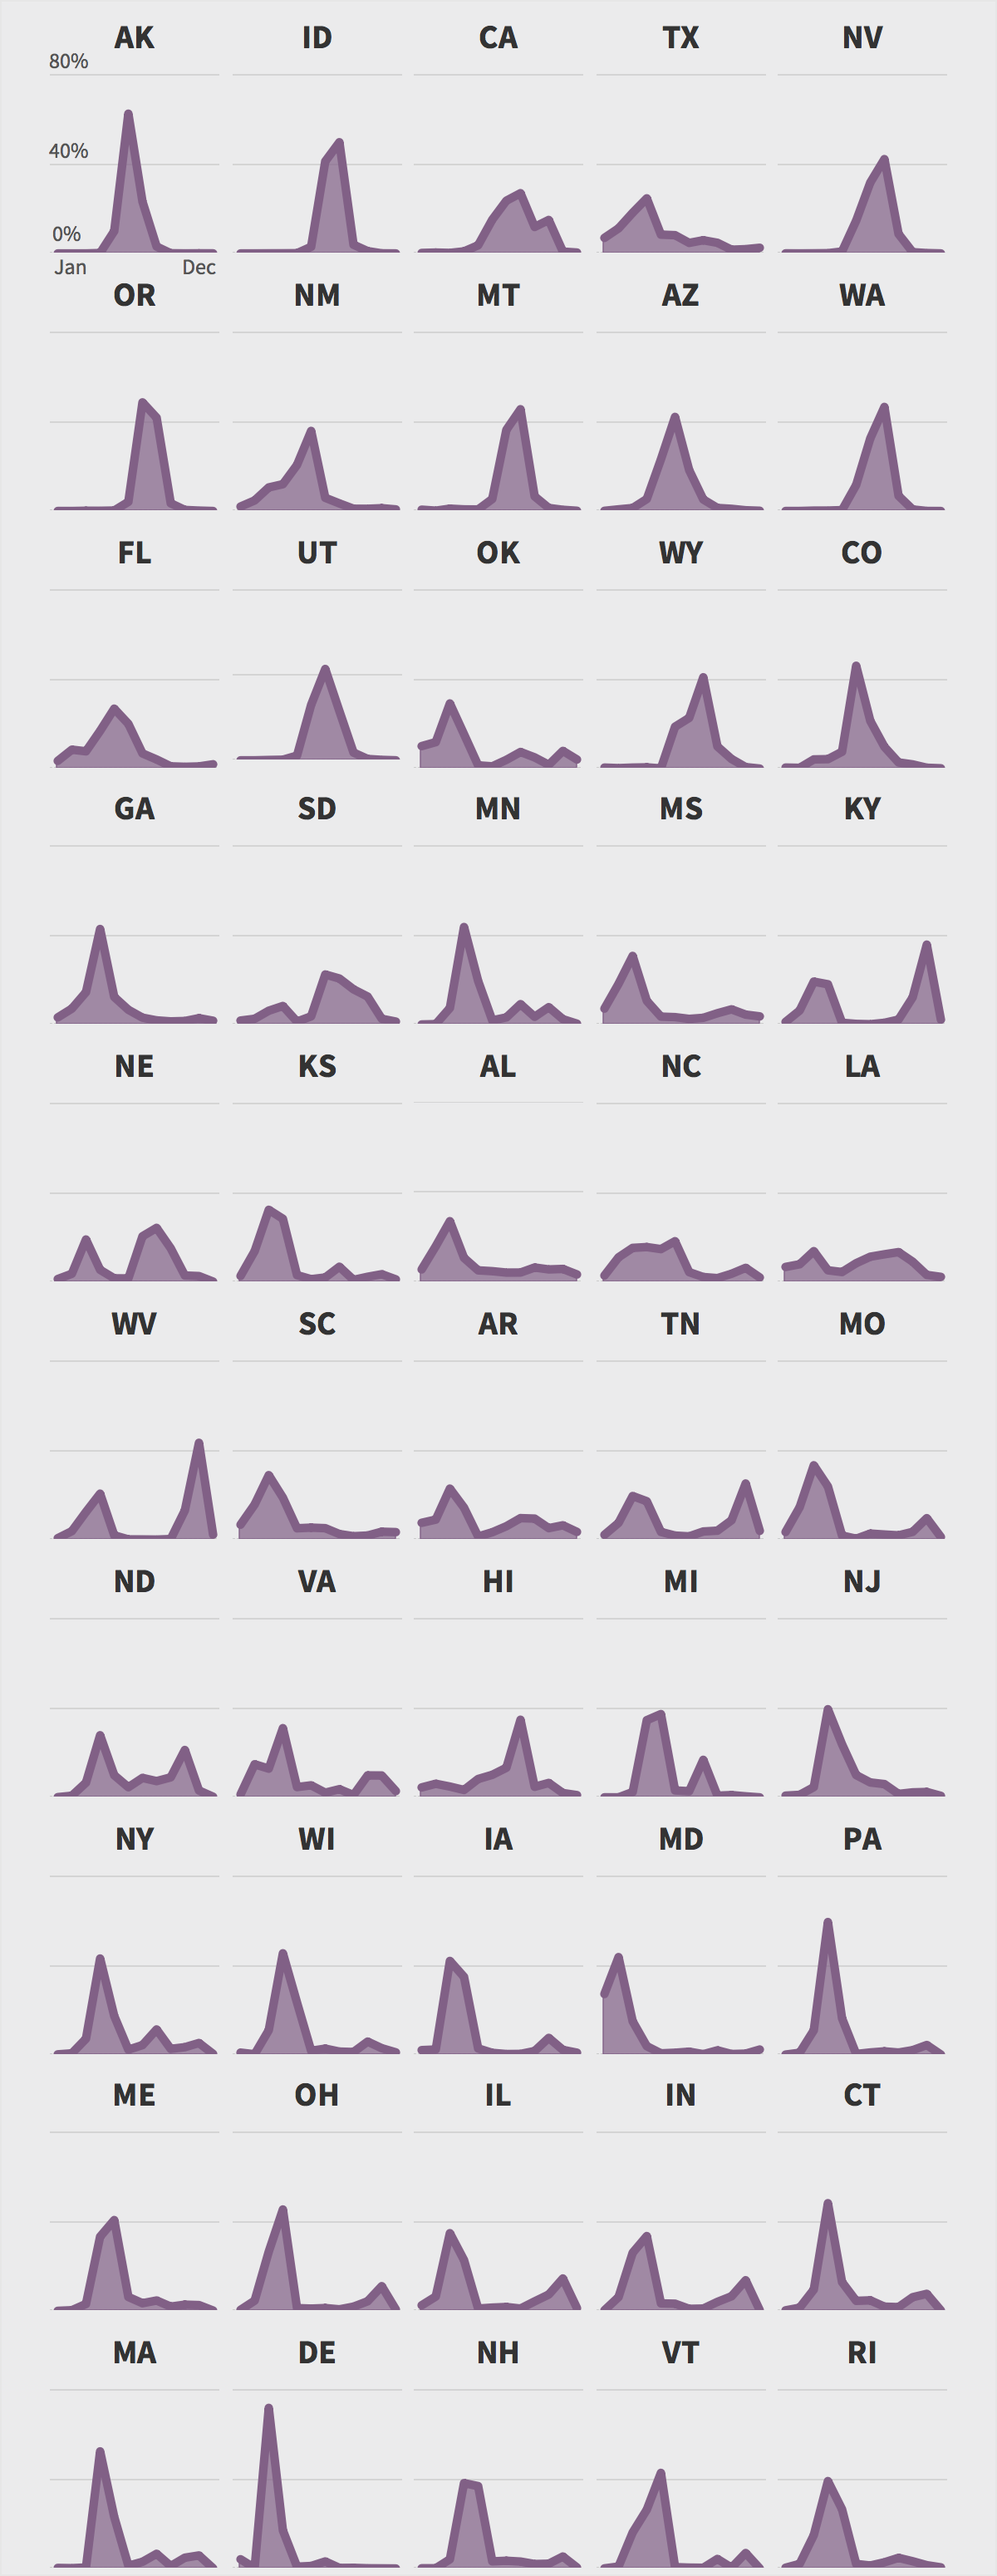
Other states follow more distinctive patterns. Florida, for instance, has seen several of its largest fires over the past two decades in May, while fires in Oklahoma has seen the most destruction in March. Between 1992 and 2015, only 16 states saw acreage burned actually peak in June, July, or August.
Peak Wildfire Season Still Varies by State
Percent of Acres Burned by Month, 1992 - 2015
Still, wildfire activity in November is relatively rare across the country. Only about two million acres burned in November over the 24 years represented in the U.S. Forest Service’s data, about 1.5% of the total nationally.
And that’s in part what makes the Camp Fire and Woosley Fire so alarming. Not only are they truly devastating tragedies, but they also represent a marked shift in wildfire patterns. Due to a confluence of factors — including climate change and short-term weather patterns — wildfires are effectively becoming a year-round threat in California.
Here’s to hoping we can find ways to safely manage wildfire activity in the future.
Methodology:
Data comes from the U.S. Forest Service’s Fire Program Analysis fire-occurrence database (FPA FOD) as compiled by Karen C. Short. While the data only run through 2015, the database is still the most comprehensive, national dataset of wildfire occurrences publicly available.
Wildfires were group into month and year of occurrence according to the “discovery date” listed in the data. County information in the dataset is based on where the fire originated.
County land estimates come from the Census Bureau.
Nerd Notes:
Map created in d3.js. Aggregation of wildfire data to each county was done using node.js and some elbow grease.
The other two graphics were created in Tableau.


