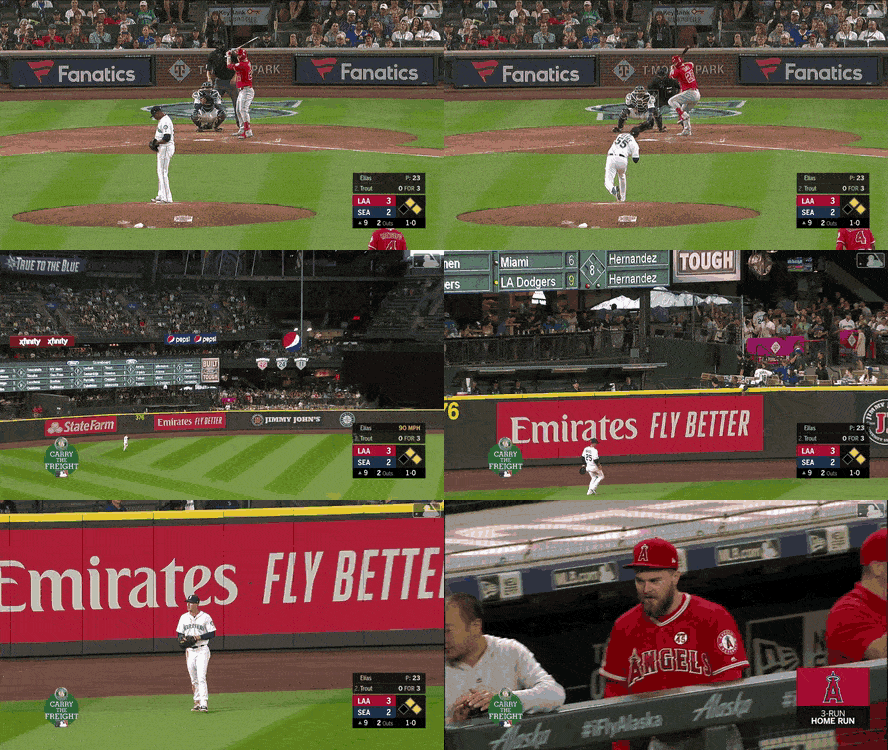
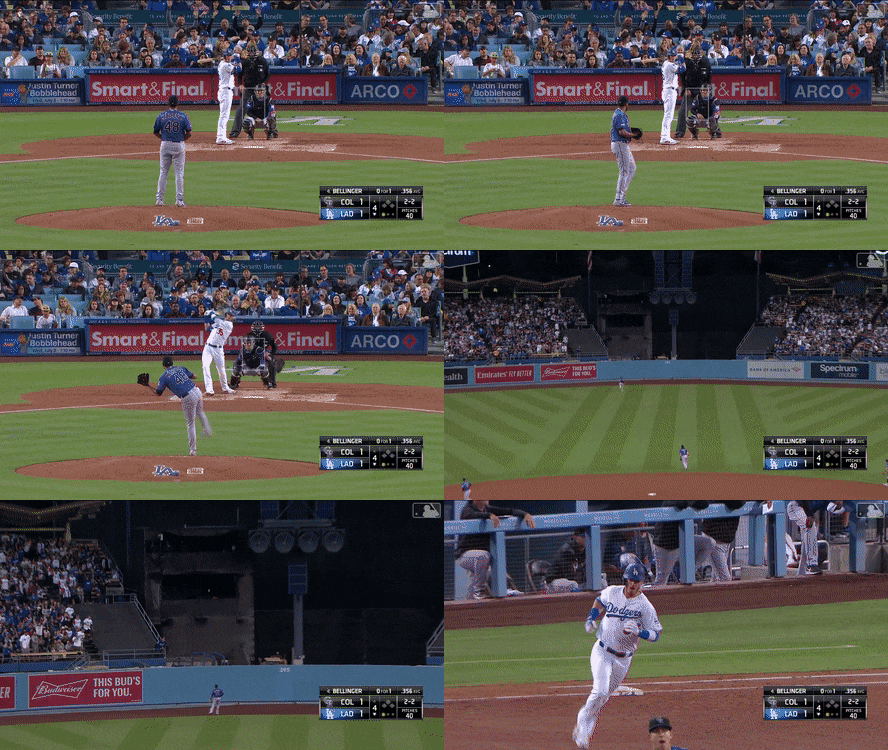
There are 30 stadiums across Major League Baseball. No two of them are the same.
Pro ballparks come in all shapes and sizes, sometimes due to the shape of the city block on which they were built, sometimes based on a team’s strengths (or weaknesses), and sometimes just to add character. Because their shapes differ, a home run hit in one park might not be a home run in another. For instance, a ball over the left field fence in Seattle might hit the Green Monster at Fenway, or a homer to deep center field at Dodger Stadium might not leave the park at Coors Field.
That’s what inspired us to create the No Doubter report. We define a “no doubt” home run as one that is hit hard enough, long enough, and high enough to leave any major league field. So far in , we’ve seen home runs. of them have been no doubters.
In this piece, the second in a series on the irregular outfields of baseball, we look at every home run hit this season to determine which can be called No Doubters. And in the process, we’re crowning the top home run hitter of .
’s No Doubt Leaders
ClickTap a player to see his home runs this season
No Doubters
Full leaderboard
No Doubt Rate
Full leaderboard
Seasonal No Doubt Rate data includes players with a minimum of 5 home runs. Monthly data includes home runs hit within one month of the most recent home run and includes players with a minimum of five. Weekly data includes home runs hit within one week of the most recent home run.
Starting last year, we used Statcast data, courtesy of MLB’s Baseball Savant, to get the trajectory for every home run hit in a season that was defined by them. We continued that this year, combining the data with outfield measurements and fence heights for every park in the big leagues to calculate if each home run was a no doubter or not.
As of , -- is this year’s leader in no doubters with 6.
The visualization below shows whether each of this season’s home runs were hit deep enough to clear the fence at a given major league ballpark.
Was That Home Run a No Doubter?
to see how it fared across MLB parks


The Toronto Blue Jays home park in 2020’s shortened baseball season is Sahlen Field in Buffalo, NY. Shown here is their usual home of Rogers Centre in Toronto.
Even though Pete Alonso set a rookie record on his way to a league-leading 53 home runs in 2019, we crowned Mike Trout last season’s no doubt king. We’d consider 18 of Trout’s 45 home runs last year to be no doubters.
Check out the full leaderboard below to see who’s on their way to becoming 2020’s true home run king. Search for your favorite player, or sort by no doubt rate, exit velocity, or distance.
Find a Player
or clicktap a player to see his home runs this season

Sorting by No Doubt Rate, Average Exit Velocity, or Average Distance filters to only those players with at least 5 home runs this season, except when viewing postseason data.
Methodology
The Project
This project was created by Sam Vickars (copy, design, code) and Michael Hester (code, data), with help from Jack Beckwith, all of The DataFace. Statcast data is from MLB’s Baseball Savant and is updated on this page regularly.
Field outlines are traced from a combination of Google Earth, aerial imagery, and official MLB field diagrams, using the diamond as a consistent scale. Wall heights are based on stadium photographs, official MLB dimensions, and Andrew Clem’s Clem’s Baseball.
We used d3 as a basis for the whole project, and specifically d3.path() to move from Illustrator to d3 SVG, as well as some very complicated math done in javascript.
The Math
To determine if a specific home run was a no doubter, we first had to determine its trajectory. We did this with six columns of Statcast data: hit_distance (projected distance), launch_angle, launch_speed (exit velocity), plate_z (height of ball at home plate), hc_x (x coordinate of batted ball), and hc_y (y coordinate of batted ball).
While Statcast’s hit distance could tell us whether a ball was hit far enough to reach the wall in another stadium, we still needed to know whether the ball would have been high enough to clear the fence. So we first calculated the batted ball’s total time in air (tT = -Vyi ∓ √(Vyi2 + 2ghi) / g), the ball’s X acceleration (ax = (-2Vix / tT) + (2dh/tT2)), and the time it would take the ball to reach the wall (tw = (-Vxi ∓ √Vxi2 + 2axdw) / ax). Then we plugged those values into this equation to determine the ball’s height at the wall: y = (Vyitw) + ½gtw2. If the ball’s height would have been greater than the fence’s height when it reached the fence in all 30 stadiums, it was considered a no doubter.
We also considered accounting for slight differences in air quality and the strength of gravity across the parks. In theory, the gravitational pull on the ball at a high-altitude park like Coors Field in Denver, Colorado will be slightly lower than at a park nearer to sea level. That would mean the value for negative vertical acceleration in the calculations above would be slightly lower, allowing the ball to carry just a little farther. After doing the math though, we found this difference to be negligible.


